Flower centerpieces and sacred places

During a recent day of learning and good conversation, I enjoyed this centerpiece:

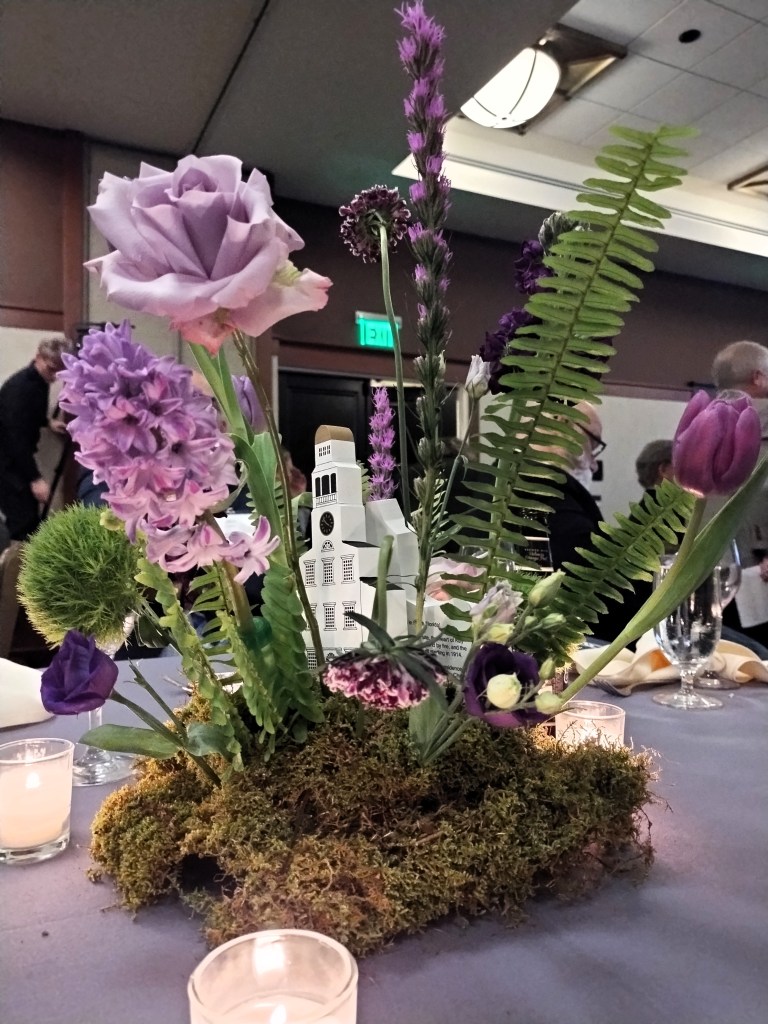
Where does one find flowers arranged around religious buildings? It makes total sense for a meeting of Partners for Sacred Places.

Robert Brenneman and I argued in Building Faith that religious buildings shape religious experiences and communities. I know nothing about centerpieces but perhaps they could have a similar effect. In a pleasant hotel meeting space with numerous round tables, the centerpieces might play multiple roles: (1) highlighting the topic at hand; (2) providing a focal point in the middle of a table that is difficult to talk across in a crowded room; and (3) providing beauty in a formal setting.

Buildings and physical settings can be purely functional. Imagine the same setting above with no tablecloth and no centerpiece. Yet, that bare bones approach is also influential. Perhaps it communicates efficiency and informality. Perhaps it reflects the resources available. The absence of decoration or “extras” could be highly intentional to promote a different message regarding beliefs and practices.

I am grateful for those with the skills and gifts to design and carry out these additions to our places.

Another composite measure: “the happiest person in America”

Happiness studies are a cottage industry unto themselves (see related posts here, here, and here for several examples) as are composite measures that tells us things like the mean population center of the United States or the world’s most typical face. Here is a new measure that gives us some information about the happiest person in America:

The New York Times asked Gallup to come up with a statistical composite for the happiest person in America, based on the characteristics that most closely correlated with happiness in 2010. Men, for example, tend to be happier than women, older people are happier than middle-aged people, and so on.

Gallup’s answer: he’s a tall, Asian-American, observant Jew who is at least 65 and married, has children, lives in Hawaii, runs his own business and has a household income of more than $120,000 a year.

This may make for an interesting news story but I’m not sure it really tells us much. Composite measures like this take different pieces of information, such as differences in happiness by gender, age, race, income, and more, and then try to attach them to a “typical” person. Is it more helpful to see a “typical” person or to have a series of graphs that show the differing levels of average happiness by various demographic characteristics? Personally, I think it would be more helpful to have the series of graphs or tables – which are also included with this story (just need to click on the tables/maps on the left side).

Of course, this article goes a step farther by trying to actually to track down someone who fits this profile. And this N of 1 who says he is “a very happy person” shows or proves what exactly?