As cities across the United States added pedestrian malls in the 1960s and 1970s, the suburb of Wheaton, Illinois considered developing its own. The efforts began in the late 1960s in the Wheaton Beautification Commission and a semi-mall was created by 1971. Today, Wheaton residents are familiar with summer dining replacing car traffic on Hale Street.
In 1969, Harland Bartholemew and Associates issued The Wheaton Comprehensive Plan for the community which the city adopted in December of that year. Prior to the plan, a survey of residents commissioned by the firm noted the downtown shopping options as both an asset and a potential issue. On one hand, some residents noted: “Shopping facilities need improvement. While there are some fine shopping centers, the facilities in the central area leave much to be desired.” On the other hand, other residents said, “There is a fair level of shopping facilities and parking.”
Among the recommendations in the 1969 report was the closing of downtown Hale Street to pedestrian traffic. Here is the vision the planners provided:
Hale Street should be improved as an attractive pedestrian shopping mall and all vehicular movements – other than emergency or service vehicles – should be eliminated….Areas along each side would receive different treatment. Some would be areas planted with low shrubs, ground cover or flowers, with the latter being changed with the seasons. These would be surrounded by low walls which could be used as seats for resting purposes. Other walks or platform areas would also be slightly raised to assist in defining the service drive. One or more of these could contain benches and simply play apparatus for small children.
The city pursued this in the following years and the City Council on September 20, 1971, adopted this resolution:
Resolution R-48-71. Whereas, the Wheaton Beautification Commission in 1967 proposed the improvement of the central business area by creating a mall-type environment on Hale Street, between Front and Wesley Streets, and Whereas, this proposal was echoed in the Wheaton Comprehensive Plan, adopted in 1969, as one of the several suggested improvements to downtown Wheaton by the business community, and Whereas, with the encouragement and leadership of the Greater Wheaton Chamber of Commerce and the financial backing of the Hale Street property owners and merchants, this proposal can soon become a reality by constructing a semi-mall with trees, planters, benches, attractive brick paving, and curvilinear street alignment and other improvements to this area; Now, therefore, be it resolved by the City Council of the City of Wheaton, Illinois, that wholehearted support be and hereby is given to this project, and that the planning, engineering, parking layout revision and certain sewer changes be the City’s contribution in making the Hale Street semi-mall a reality; Be it further resolved that the proper departments of the City be authorized to proceed with the work upon establishment of an escrow account containing funds sufficient to finance the project…Motion carried unanimously…”
A description from the 1971 annual report sums up the changes made:
They did, however, join in the creation of a major accomplishment of 1971: the Hale Street semi-mall. Proposed by the City’s planning department and endorsed by the Beautification Commission nearly four years ago, the plan was revived with the help of the Greater Wheaton Chamber of Commerce, nurtured with the funds of Hale Street property owners and businessmen, and finally implemented by the City. The mall was officially opened on November 29th, and will provide future shoppers and visitors with an attractive invitation to stroll down Hale Street, browse a bit, and hopefully find what they need in the many quality shops on both sides of the gently-curved street. After shopping the customer can rest a while on one of the attractive planter benches surrounded by an area of paving brick. The Hale Street semi-mall, the first such project in the metropolitan area…
In 1975, a Chamber of Commerce publication said, “The completion of the Hale Street Mini-Mall inaugurated a greater impetus for change and growth in the seventies.”
In 1982, the downtown was struggling. In a local newspaper article discussing concerns, the suburb’s city planner said, “a pedestrian mall such as the one suggested in the early 1960’s, would be “disastrous” to merchants not in the mall.”
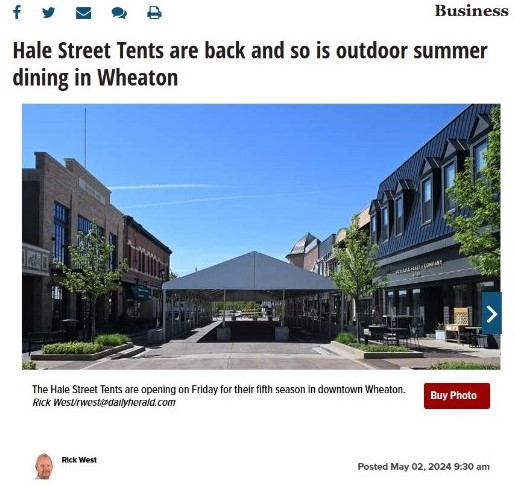
COVID-19 led to the complete removal of vehicular traffic on Hale Street in 2020. This continued each summer through 2024 as restaurants and residents enjoyed the extra dining space.
In sum, it appears Wheaton followed the broader patterns regarding pedestrian malls: it saw it as a possible solution to shopping activity moving out of downtowns and to strip malls and shopping malls, it put together a semi-mall with a curved street and limited traffic, and that mall faded away over time. With the onset of COVID-19 in 2020 and revived interest in more places in outdoor dining, a pedestrian mall has returned during warmer months.