
According to the Census Bureau, spending on religious construction has increased in the last few years after dropping in the 2000s. Here is the graph of monthly spending on religious construction from January 2002 to August 2026:
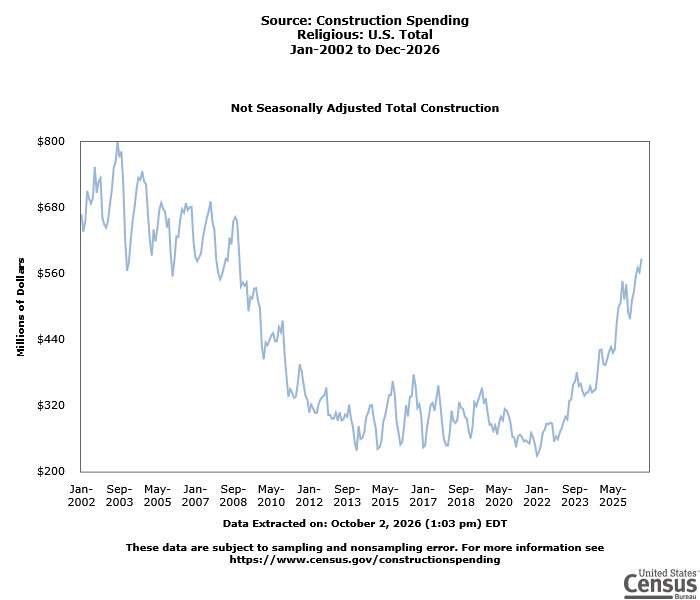
Two features of this graph stand out to me.
- There is a decline in spending from a peak in late 2003 to less construction from roughly mid-2010 to late 2023.
- Spending is back up since 2022.
I can guess at a big reason for the decline in construction. Real estate crisis. Uncertainty. Not the time to start large building projects, especially if funded by congregations.
The uptick in construction is more interesting. Coming out of the COVID-19 pandemic, what is driving more religious construction spending? New congregations? Growing religious traditions? A lot of repairs to religious buildings that had been put off since the late 2000s?
Part of the reason I ask is I have seen construction spending figures cited to help show the growth of religious activity in the United States after World War Two. After the war ended and the population started growing amid prosperity, religious construction spending went up. Numerous religious buildings were constructed as religious activity increased.
What story will be told in a decade or two about the spending graph above? What data will it be put alongside to describe and explain religious activity in the United States?

