The populations of the “safest and wealthiest suburbs” in the US

A new list of high income and low crime suburbs has this top ten:

Photo by Phyllis Lilienthal on Pexels.com
  1. Western Springs, IL
  2. Lexington, MA
  3. Winchester, MA
  4. Whitefish Bay, WI
  5. Huntington Woods, MI
  6. Ottawa Hills, OH
  7. Winnetka, IL
  8. Kenilworth, IL
  9. University Park, MD
  10. Upper Arlington, OH

Here is how GOBankingRates.com developed the list:

GOBankingRates analyzed the top 1,000 cities by household mean income across the United States to find the safest and richest cities using data from the US Census American Community Survey, Bureau of Labor Statistics Consumer Expenditure Survey, Zillow Home Value Index, Federal Reserve Economic Data, AreaVibes, and the FBI. The property crime rate per 1,000 residents, violent crime rate per 1,000 residents, livability score, household mean income, and the average total cost of living were scored for each location and sorted to show the safest and richest cities. All data was collected on and is up to date as of August 4th, 2025.

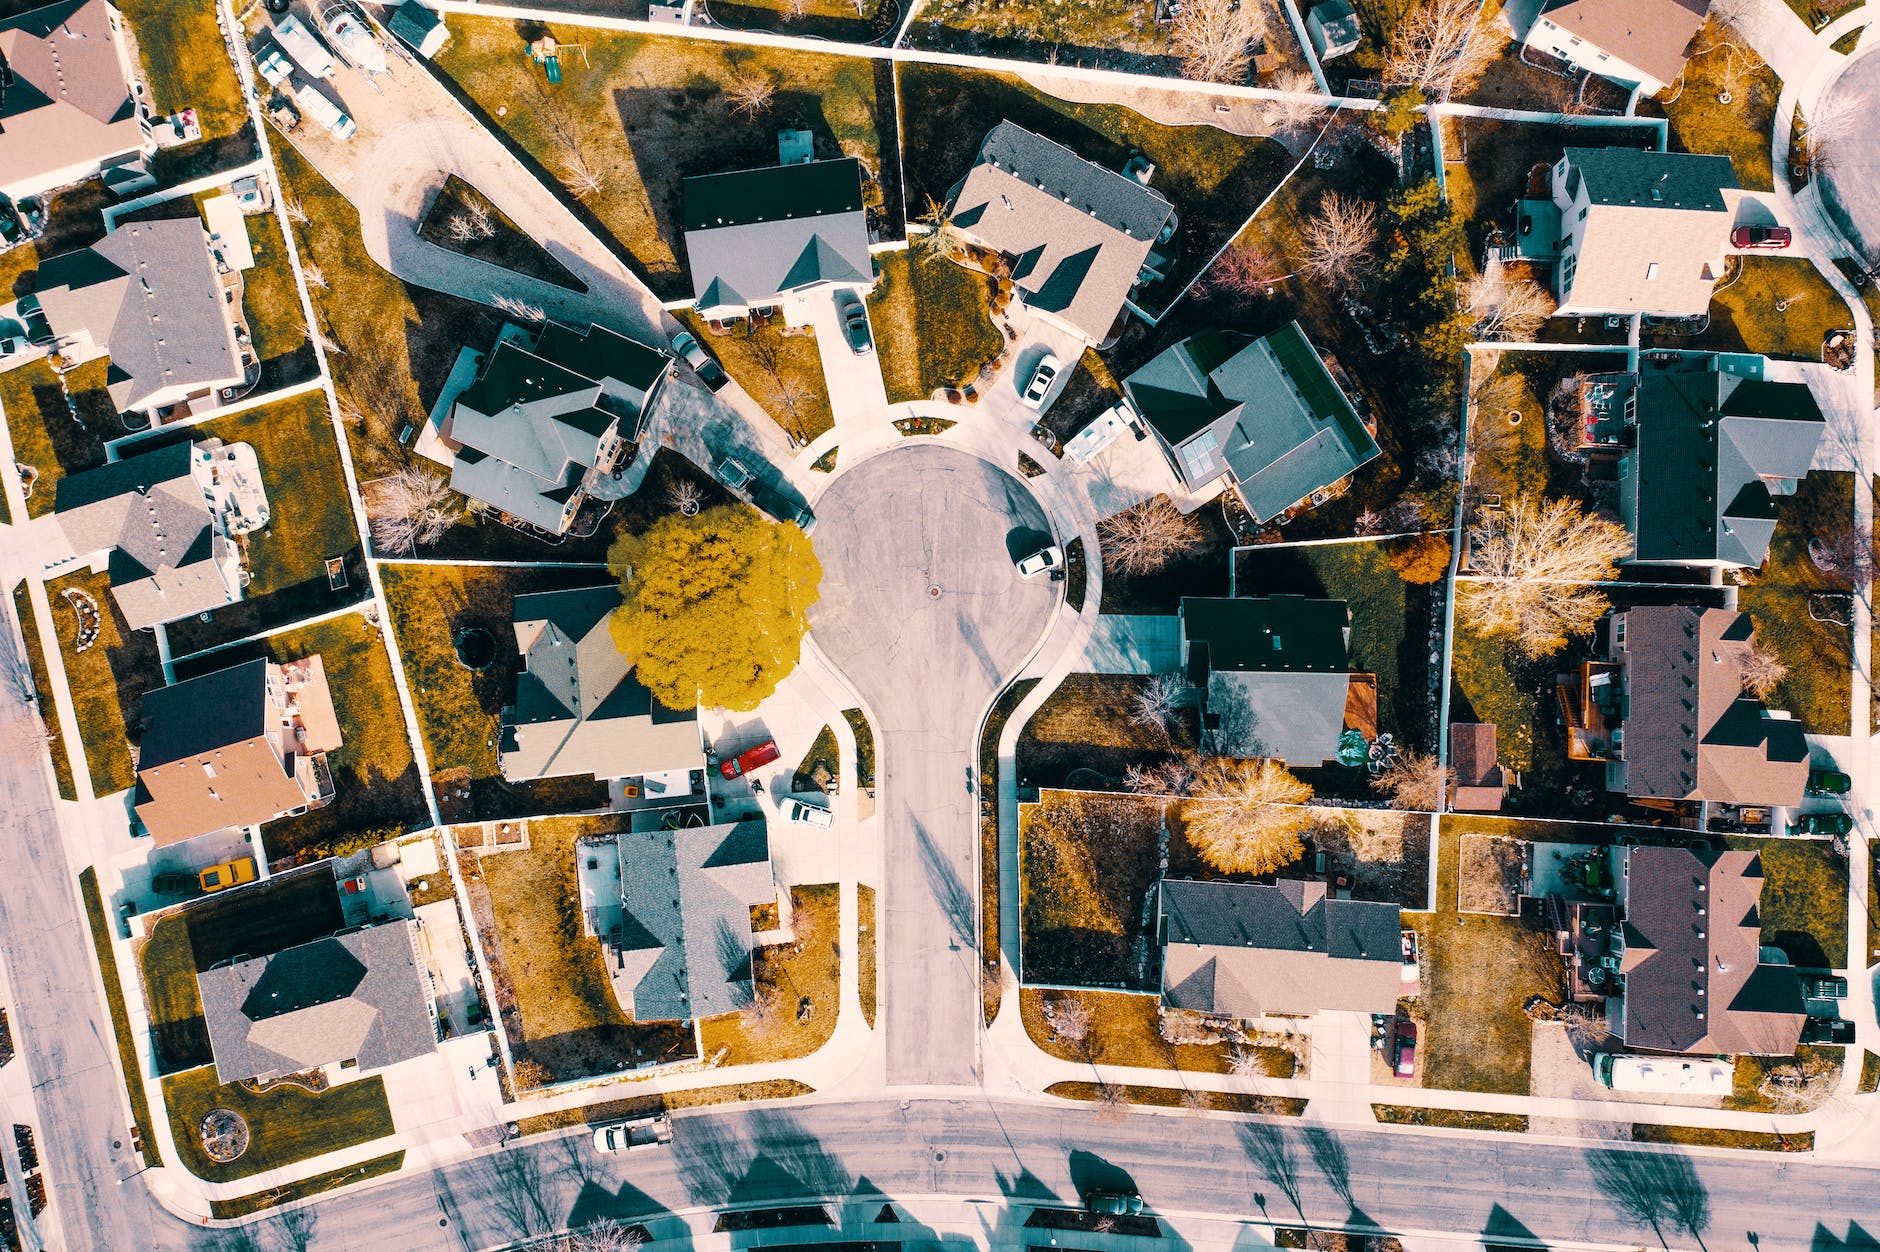
Based on a recent post about the wealthy and large suburbs of the United States, including Naperville, Illinois, I was curious about the population size of the top ten communities. Here is their population according to Quick Facts:

  1. 13,600
  2. 34,400
  3. 22,900
  4. 13,700
  5. 6,300
  6. 4,500
  7. 12,100
  8. 2,400
  9. 2,400
  10. 35,300

Not all of these are small towns; some might even be considered small cities. All have household mean incomes of over $200,000.

Going further through the top 50 suburbs, few are really large. Naperville comes in at #49, the largest suburb by population on the list by far.

To make this list, a suburb does not have be small and exclusive. It can be slightly larger and exclusive. I wonder if this is due to using the household mean income rather than the median. The mean is more likely to be pulled up by a small number of really high earners while the median gets at the midpoint of the distribution.

The wealthy and big suburbs in the United States

Lists of the wealthiest communities in the United States often feature places with just a few thousand residents. But in looking at a list of the fastest-growing suburbs in the United States, I noticed that some of these fast-growing and large suburbs have high median household incomes. Here are 3 suburbs in the top 5 fastest-growing:

Photo by Photo By: Kaboompics.com on Pexels.com
SuburbPopulationMedian Household Income
Frisco, TX210,238$146,158
McKinney, TX202,314$120,273
Santa Clarita, CA229,021$119,926

For 2023 (the same year at the end of the data used for this list), the Census Bureau reported that the median household income in the United States was $80,610. The median income means that half of households are above this mark, half are below. These suburbs are way over this mark and they have a lot of residents.

I have wondered about this given my research over the years on Naperville, Illinois. It is a larger suburb – around 150,000 residents – and it is wealthy. In 2023, its median household income is $150,937.

Knowing what I know about Naperville, my guess is that the three communities above are home to thousands of white-collar professional jobs. They have lots of office space. They are home to national and/or regional headquarters for sizable corporations. They have a particular quality of life residents expect.

At the same time, people living in these large and wealthy suburbs might have different experiences from those living in small and wealthy communities in the United States. What does this wealth and access to resources look like on a daily basis? What kind of community engagement and spirit is there? What separates these bigger and smaller wealthy suburbs from the communities around them that are not the same?

And Area Median Income limits in California

The Chicago region has particular Area Median Income limits. How might they compare to the AMI limits in California?

Photo by Darin Phillips on Pexels.com

In Orange, Santa Barbara and San Diego counties, the threshold for a low-income single-person household will soon surpass $100,000 if current trends continue, according to data published by the California Department of Housing and Community Development in April.

They would join three Bay Area counties that already hit that bureaucratic threshold.

California defines income levels by how they compare with the area’s median income. But in areas with unusually low or high housing costs, those definitions are often tweaked to reflect the reality on the ground for residents. Therefore, someone earning $100,000 could be above the area’s median income line but be considered low-income because of the high cost of housing. A number of government programs use these income designations to determine who qualifies for benefits such as housing assistance…

Between 2020 and 2025, the threshold to be considered low-income rose 40% across Southern California’s ten counties, reflecting the rising cost of living across the region.

At the same time, median incomes — representing the middle, not the average — across the region rose 35%.

Similar concept applied to a very different housing situation yields very different AMI limits. California housing prices are higher to the degree that the median income needed is much higher than in the Chicago region. Someone from the Chicago region might see this story about California regions and think that the housing situations are barely comparable.

At the same time, both regions struggle to provide affordable housing. The income levels may differ as might the physical landscape but both share limited appetites from municipal officials, developers, and residents for affordable housing.

Thinking beyond these two regions, are there regions that are doing better at constructing more units of affordable housing? Where incentives and local guidelines and people encourage affordable housing? Where there is good housing available at more or all of the points of the AMI limits?

Area Median Income limits for the Chicago region

I recently read about a proposed affordable housing development in the Chicago suburbs that invoked the Area Median Income for the region:

According to a memo, The Residences at River Point would set aside one-quarter of the apartments for households making 30% or less of the area median income. Roughly half would be earmarked for households making 60% or less of the AMI, and the rest would be for those making 80% or less of the AMI.

According to the federal Housing and Urban Development Department, the AMI for the Chicago metropolitan area, which includes Kane County, is $50,976 for a four-person household.

The AMI is set by HUD who has a chart of the various cutoff points for the AMI for the entire region. From the City of Chicago:

For those who have not run into these figures before, several things from this chart might stand out:

  1. The AMI depends on household size. Discussions of housing and affordability can often focus on median household incomes but HUD adjusts for the total number of people in the household. This fits with housing with more space and bedrooms generally being more expensive.
  2. The AMI figures are for an entire region. The Chicago region includes more than 9 million residents and hundreds of municipalities. While the AMI limits for Chicago might differ quite a bit from other regions, there can be quite a bit of variation within the region as well regarding incomes and housing prices.
  3. These income guidelines apply to a number of programs but are not the only metrics that might be used regarding housing affordability.

Who is affordable housing in Naperville for? September 2022 edition

Two recent proposals aim to bring affordable housing to Naperville. The first project had 401 housing units and the affordable housing units within the development would be for this group:

Photo by Michael Tuszynski on Pexels.com

While the council has not adopted any measure requiring affordable housing, Pulte designed Naperville Polo Club in response to the city’s stated priorities, Whitaker said. They are committing to sell 20% of the town homes at an affordable level based on area median income, or AMI.

“Pulte will target buyers at 80-100% Naperville AMI consistent with household income targets set forth in SB Friedman’s Affordable Housing Program,” Whitaker said in the letter. “This target demographic for for-sale housing represents household incomes of approximately $100,000 to $125,000 and translates to a home purchase price below $440,000.”

With the median household income of DuPage County at over $94,000 and Will County at over $90,000 – Naperville spans both counties – this affordable housing is only accessible to people above the lower 50% of household incomes in the counties.

The second project involves affordable units set aside for two groups who need them:

It’s not often the Naperville City Council receives a standing ovation.

But it happened Tuesday after a 9-0 vote authorizing pursuit of an affordable housing project on city land southeast of the corner of 103rd Street and Route 59 on Tower Court. As part of the potential agreement for development, a minimum of 60 units would be built for seniors and for adults with intellectual or developmental disabilities.

When the vote finished, more than a dozen audience members clad in red shirts with “I (heart) affordable housing” written on them stood and cheered the decision — more than a year in the making — that paves the way for young adults with special needs to live independently.

In both cases, housing is needed.

But, what is “affordable housing” about? Is it about keeping Napreville residents in Naperville like seniors and young college graduates? Is it about providing housing that provides no threat to larger homes and higher property values? Is it about providing units to those who live and work in wealthier suburbs but cannot easily afford to live there? Is it about providing units within a region where tens of thousands need affordable housing? Is it about providing housing for those who could not otherwise live in a wealthier suburb?

How can Lake County, Illinois be #9 on the list of “America’s Most Miserable Cities”?

Forbes just put out their 2013 list of “America’s Most Miserable Cities.” Out of the top 20, there is one that is not like the others: Lake County, Illinois at #9. Here is the short description of why Lake County made the list:

The Chicago suburb is one of the richest counties in the U.S., as measured by per capita income. But home prices are down 29% over the past 5 years. Other drawbacks: long commutes and lousy weather.

There are numerous problems with this:

1. Calling an entire county a suburb is strange. Lake County is made up of dozens of suburbs which are quite varied. For example, look at quick overviews of Deerfield versus Grayslake versus Waukegan. Lumping them all together is silly and is one of the traps many people make when looking at the suburbs: they are not all the same kind of places.

2. How does a county end up on this list when the rest of the top 20 are cities? In terms of categories, a suburban county is not in the same category as a city. While there might be some identity in saying one is from “Lake County,” it is nowhere close to being a singular city.

3. Just glancing at this description and the top 20 cities on the list, I have to wonder how Lake County could even make the list. According to this list, Lake County is the 56th wealthiest county in the United States with a median household income of $74,266. Here is a bit more on the methodology:

We looked at the 200 largest metropolitan statistical areas and divisions in the U.S. to determine America’s Most Miserable Cities. The minimum population to be eligible was 259,000. We ranked each area on 9 factors, including average unemployment rate between 2010 and 2012; median commute times to work for 2011 based on U.S. Census data; violent crimes per capita from the FBI’s 2011 Uniform Crime Report.

We included three housing metrics: the change in median home prices between 2009 and 2012; foreclosure rates in 2012, as compiled by RealtyTrac; and property tax rates based on median real estate taxes paid and median home values in 2011 per the U.S. Census. We factored in income tax rates and the weather in each metro on factors relating to temperature, precipitation and humidity. The data metrics are weighted equally in the final scoring.

We tweaked the methodology in this year’s list in response to feedback from readers, dropping our rankings of both pro sports team success and political corruption, since both were based on regional, rather than city-specific data. We also added a new measure—net migration—which we see as a clear gauge of whether or not residents feel a community is worth living in.

If this methodology puts Lake County at #9, Forbes may want to revisit their criteria.

New census findings on growing American income gap

The United Census Bureau released 2009 income figures recently and the news is not good: the income gap between the richest and poorest is at its widest level since 1968.

The top-earning 20 percent of Americans — those making more than $100,000 each year — received 49.4 percent of all income generated in the U.S., compared with the 3.4 percent earned by those below the poverty line, according to newly released census figures. That ratio of 14.5-to-1 was an increase from 13.6 in 2008 and nearly double a low of 7.69 in 1968.

A different measure, the international Gini index, found U.S. income inequality at its highest level since the Census Bureau began tracking household income in 1967. The U.S. also has the greatest disparity among Western industrialized nations.

At the top, the wealthiest 5 percent of Americans, who earn more than $180,000, added slightly to their annual incomes last year, census data show. Families at the $50,000 median level slipped lower.

Several key things to note:

1. A complete historical perspective is not possible since the Census didn’t collect household income information before 1967. But this most recent data can still be compared to 40+ years.

2. The US has the largest Gini coefficient, a statistic used in a lot of international comparisons of income, of any “Western industrialized nation.”

3. Even with the recent economic troubles, the incomes of the wealthiest (the top 5%) went up while those around the median income (about $50,000), with 50% of American below this income level, went down.

These are statistics that still matter and have important societal consequences without having to get into a discussion about whether it is moral or immoral for people to earn a lot of money.