“I don’t think anybody expects somebody in Evanston to support a family on this salary, so whether they have other employment or other wealth or, as in my case, right now they have a spouse who works full-time, I think certainly the expectation is there’s some other reason that they’re able to stay afloat.”…
Evanston is not unique in this regard. Municipalities across the North Shore tend to offer modest compensation for mayoral and other top elected offices, begging similar questions about who can afford to serve…
And Hansen said research suggests that low-pay and unpaid municipal positions tend to have less competition and therefore are more conducive to a higher rate of diversity among elected leaders who come from a wider range of backgrounds.
Historically, however, even “poorly paid positions still tend to be primarily held by white-collar professionals for reasons that aren’t directly related to the salary offered by the office,” like professionals being able to more easily raise campaign money or because they have “greater autonomy over their time, both to campaign for office and to serve if they win,” Hansen said.
Local elected officials have important roles in their suburban communities. They help make decisions in communities, they are at events in the community, and they serve as figureheads for the community.
Hinted at but not stated explicitly in the article is that there are local government staff that do a lot of day to day work. They are not typically elected.
You can see some of this dynamic at local meetings. Say there is a new development proposed for the community. Elected officials have roles and government staff have roles.
It would be interesting to put the question to local voters: should local government staff and/or local officials have higher salaries? Present the argument to the voters, including the effects on who might run or how this might affect local services and decision-making.
I recently found a list of wealthy American with the most population growth. But I noticed that the list ends with two suburbs that lost population during the time period of interest (2018-2023). I suspect this might be because how they selected the communities on the list.
Methodology: For this study, GOBankingRates analyzed suburbs to find the fastest-growing wealthy suburbs in America. First GOBankingRates found the places with a population between 25,000 and 100,000 according to the U.S. Census American Community Survey. The metro area for each location was found and only the metro areas with a population of 1 million or more were kept. With these suburbs isolated, the numerical and percentage change in population from 2018 to 2023 were found for each city using data from the American Community Survey Census from 2018 and 2023. For each location, GOBankingRates found total population, population ages 65 and over, total households, and household median income all sourced from the American Community Survey. Only places with a median household income of $150,000 or more were kept for this study. Using this data the percentage of the population ages 65 and over were calculated. The cost-of-living indexes were sourced from Sperling’s BestPlaces and include the grocery, healthcare, housing, utilities, transportation, and miscellaneous cost of living indexes. Using the cost-of-living indexes and the national average expenditure costs, as sourced from the Bureau of Labor Statistics Consumer Expenditure Survey, the average expenditure cost for each location were calculated. The livability index was sourced from AreaVibes for each location and included as supplemental information. The average single-family home value was sourced from Zillow Home Value Index for November 2024. Using the average single-family home value, assuming a 10% down payment, and using the most recent national average 30-year fixed mortgage rate, as sourced from the Federal Reserve Economic Data, the average mortgage can be calculated. Using the average mortgage and average expenditure costs, the average total monthly and annual cost of living were calculated. The cities were sorted to show the highest percentage population increase first to show the places with the fastest-growing wealthy suburbs in America. All data was collected on and is up to date as of Jan. 6, 2025.
The bigger question is this: how many suburbs in the United States of population 25,000 to 100,000 have median household incomes over $150,000? I suspect this is not a huge list. Hence, there are only 28 suburbs who meet this criteria and grew between 2018 and 2023.
But it may not take much to change the parameters to include more suburban communities on the list. For example:
What if the median household income was $140,000? Is there a strong reason for leaving the cutoff at $150,000?
Why limit the population to communities between 25,000 and 100,000? If the list could includ communities between 10,000 and 100,000, are there now more growing wealthy suburbs?
Limiting the analysis to metropolitan areas with 1 million people reduces the number of possible regions and suburbs. If the cutoff is 1 million people in an MSA, this means a little over 50 regions are included. Lower the region’s population and you would have more suburbs that might meet the criteria.
Change the list from 30 suburbs to 20 and then the last one on the list would have 5% population growth.
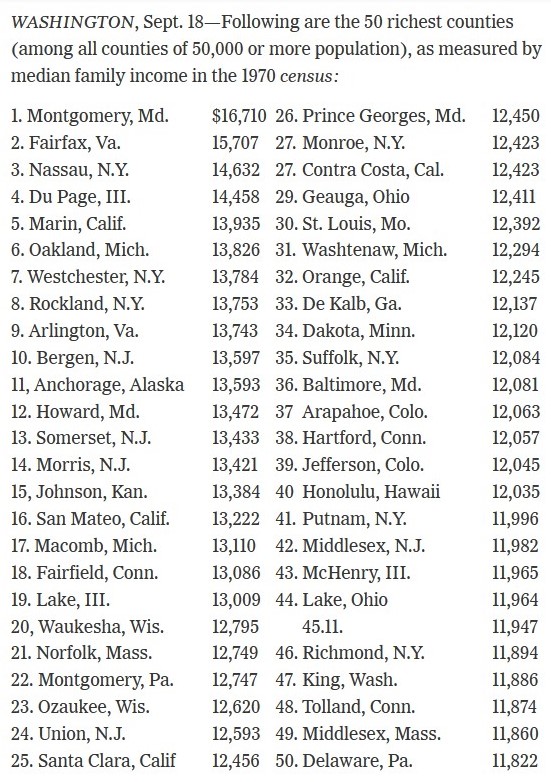
As the article notes, all these counties are suburban counties.
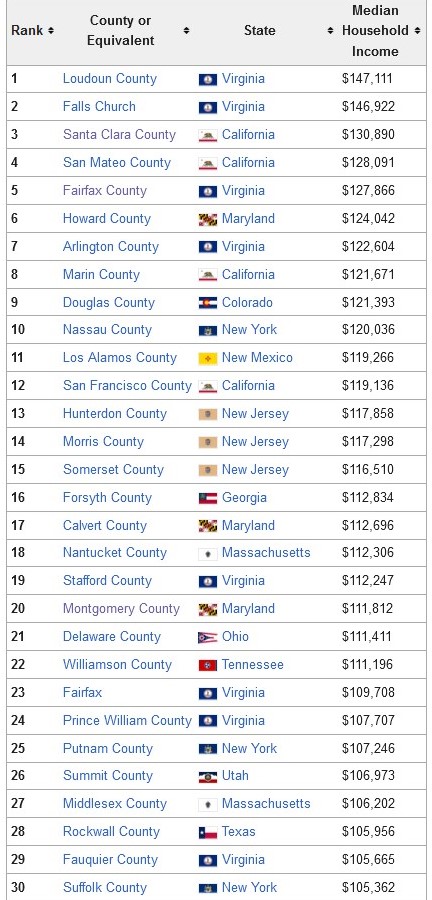
According to Wikipedia, here are the wealthiest counties today:
Almost all of these top 30 are suburban. But the wealthiest counties have shifted toward more counties in the South and West. Some of the same counties are at the top of the list but there are also new counties there as well. What might have happened in 50+ years? Some guesses:
Some of the wealthier counties in the 1970 Census matured, now have slower growth, and have more diverse populations. In contrast, the rapidly growing counties today are more in the South and West.
Shifts in industry. Manufacturing jobs declined in many places and growing sectors, such as tech and the federal government, generated wealth elsewhere.
Measuring at the county level might obscure patterns at the municipality level and at the regional level. For example, this may be less about individual counties and more about a region – say like the Washington, D.C region – growing.
I would be interested to hear how many companies and residents think at the county level these days. If someone were going to move, would they think in terms of Westchester or Nassau Counties outside of New York City like they might have in 1970 or would they think instead of specific communities and suburbs they have heard about?
Charles Schwab today released additional findings from its 2024 Modern Wealth Survey. Since 2017, Schwab has collected data annually on Americans’ perspectives on saving, spending, investing, and wealth. This year’s study reveals that Americans now think it takes an average of $2.5 million to be considered wealthy – which is up slightly from 2023 and 2022 ($2.2 million).
By generation, Boomers have the highest threshold of what it takes to be considered wealthy, at $2.8 million, while the younger generations, Millennials and Gen Z, have lower thresholds of what is considered wealthy. At the same time, Americans say that the average net worth required to be financially comfortable is $778,000. The average net worth required for financial comfort reached a peak last year at $1 million, but this year, Americans’ estimations are more in line with 2022 ($775,000) and show an upward trend when compared with 2021 ($624,000).
Income is one measure of considering status and social class and wealth – adding up assets and subtracting debts – is another way. It may have benchmark figures like income does; perhaps making six figures is similar to being a millionaire or the median income might be akin to median wealth.
The survey referenced above has less intuitive figures after considering all the responses. To be wealthy, $2.5 million is up from previous years. It is certainly above $1 million and $2 million. It feels oddly specific, as if having $2.3 million would not quite qualify but $2.8 million certainly does (even for Boomers!).
The figure for being financially comfortable is also interesting: $778,000. Less than $1 million, more than $500,000. The figure has gone up and done in recent years. Having less than $778k feels uncomfortable and insufficient?
This would be fascinating to track over time with multiple kinds of data. If asked to add up different costs or expenses people might face, would the responses from the survey be revised upward or downward? Does this depend highly on the respondent’s current income level or cost of living or other traits? How much do broader economic factors affect the responses people give?
Cash aid without conditions was considered a radical idea before the pandemic. But early results from a program in Stockton, Calif., showed promise. Then interest exploded after it became clear how much COVID stimulus checks and emergency rental payments had helped people. The U.S. Census Bureau found that an expanded child tax credit cut child poverty in half. That is, until the expansion ended and child poverty spiked.
Around the country, from big cities to rural counties, there’ve been more than 150 basic income pilots, and counting. Supporters say it works because people can spend the money on whatever they need most…
The pandemic also spurred cash aid because cities got their own pot of COVID relief money. Many are using that to fund guaranteed income pilots. Philanthropic donations are another major funding source, including from groups that have long organized direct cash payments to combat poverty in developing nations.
The pilots target low- to moderate-income people, from a few hundred to a few thousand households, and generally pay them $500 or $1,000 a month for a year or two.
Here is one way to think about such programs: the United States often focuses on helping people or social actors reach their top potential. Whether in education or in innovation, why not enable the top performers to be even better performers? But, another way to operate is to help raise the floor in areas like income so fewer people struggle. These programs seek to provide monies so that people with less income have more opportunities.
Given the outcomes of these programs plus some of the outcomes of the COVID-19 aid, my guess is that we will see more of this with hopefully positive outcomes for people and communities.
The biggest point of contention between the two camps revolves around “unreported income,” more commonly known as tax evasion. Tax returns are the best data source available for studying income distributions, but they’re incomplete—most obviously because people don’t report all of the income that they’re supposed to. This information gap requires inequality researchers to make some educated guesses about how unreported income is distributed, which is to say, about who is evading the most taxes. Piketty, Saez, and Zucman assume that it’s the people who already report a lot of income: Think of the well-paid corporate executive who also stashes millions of dollars in an offshore account. Auten and Splinter, by contrast, assume that those who evade the most taxes are people who report little or no income: Think plumbers or housekeepers who get paid in cash. They believe, in other words, that members of the 99 percent are a lot richer than they look…
To take the true measure of inequality, economists need a way to account for all the income and expenses that don’t show up on people’s tax returns. The method that Piketty, Saez, and Zucman pioneered, and that Auten and Splinter follow, was to take the gross domestic product—a measure of all of the spending in the national economy every year—and figure out who exactly is receiving how much of it. (Technically, they use something called gross national income, which is a close cousin of GDP.) The benefit of this approach is that nothing gets left out. The drawback is that, well, nothing gets left out. GDP measures the total production of an entire economy, so it includes all sorts of expenditures that don’t seem like income at all.
Much of the difference between the authors’ estimates of inequality hinges on how they treat government spending on things that benefit the public at large, such as education, infrastructure, and national defense. Because this spending is part of gross national income, it must be allocated to someone in order for the math to work out. Piketty, Saez, and Zucman take the view that this stuff really shouldn’t be considered income, so they allocate it in a way that doesn’t change the overall distribution. Auten and Splinter, however, argue that at least some of this money should count as income. Citing research indicating that education spending tends to disproportionately benefit lower- and middle-income kids, they decide to allocate the money in a way that increases the bottom 99 percent’s share of income—by a lot. Austin Clemens, a senior fellow at the Washington Center for Equitable Growth, calculates that in Auten and Splinter’s data set, a full 20 percent of income for those in the bottom half of the distribution “comes in the form of tanks, roads, and chalkboards.”…
The deeper you get into how GDP is actually calculated and allocated, the more you feel as though you’ve fallen through a wormhole into an alternate dimension. Let’s say you own a house. Government statisticians imagine that you are renting out that house to yourself, calculate how much money you would reasonably be charging, and then count that as a form of income that you are, in essence, paying yourself. This “imputed rent” accounts for about 9 percent of all GDP, or more than $2 trillion. Or suppose you have a checking account at a major bank. Statisticians will calculate the difference between what the bank pays you in interest on that account (usually close to nothing) and what you could have earned by investing that same money in safe government bonds. That difference is then considered the “full value” of the benefits you are receiving from the bank—above and beyond what it actually charges you for its services—and is therefore considered additional income for you, the depositor. All of these choices have some theoretical justification, but they have very little to do with how normal people think about their financial situation.
These are common issues working with all sorts of variables that matter in life: trying to collect good data, operationalization, missing data, judgment calls, and then difficulty in interpreting the results. In this case, it affects public perceptions of income inequality and big questions about the state of society.
Is this just an arcane academic debate? Since academics tend to want their work to matter for society and policy, this particular discussion matters a lot. Every day, economic news is reported. People have their own experiences. Humans like to compare their own experiences to those of others now and in the past. People search for certainty and patterns. The question of inequality is a recurrent one for numerous reasons and having good data and interpretations of that data matters for perceptions and actions.
The way that academics tend to deal with this is to continue to measure and interpret. Others will see this debate and find new ways to conceptualize the variable and collect data. New studies will come out. Scholars of this area will read, discuss, and write about this issue. There will be disagreement. Conditions in the world will change. And hopefully academics will get better at measuring and interpreting the concept of income.
I interviewed nine real-estate experts to help me understand why the numbers vary so much and, I hoped, help me figure out the right one to use for myself. They confirmed that, yes, the mortgage-affordability numbers are all different, and though some lenders use them to approve mortgages, they are basically guesstimates. “To some extent, they’re plucked out of the air,” Robert Van Order, an economics professor at George Washington University, told me. “A lot of these numbers are pretty arbitrary,” added Edward Seiler, the associate vice president of housing economics at the Mortgage Bankers Association. “It’s just based on people staring at data and thinking, What are the tipping points that force people into delinquency?” If the percentages don’t seem ironclad, it’s because they aren’t.
If these numbers are at the upper end of what people should spend, what do people actually spend?
Despite hearing the 30 percent figure from many of the experts I talked with, I was surprised to learn that most current homeowners actually spend much less on their housing. So do most renters. The median homeowner with a mortgage spends 16 percent of their gross income on their house payment, including taxes and insurance. That number is higher—24 percent—for low-income households, but it’s still less than 30 percent. Renters spend an average of 26 percent of their income on housing. In other words, if you take the mortgage calculators at their word and spend 28 percent, you’re paying much more for a house than the average American does.
Medians can disguise a lot of variability. In certain housing markets or in certain economic conditions or certain personal circumstances, the top end percent might be very helpful. In other situations, it may not matter as much.
Even with the variation in recommendations, it appears they roughly fall into a range of 25-35% of income. Would it be better then to suggest to people that they should aim to spend at most a quarter to one-third of their income on housing? This does not have the convenience of a single number but the range could fit a broader set of conditions and circumstances.
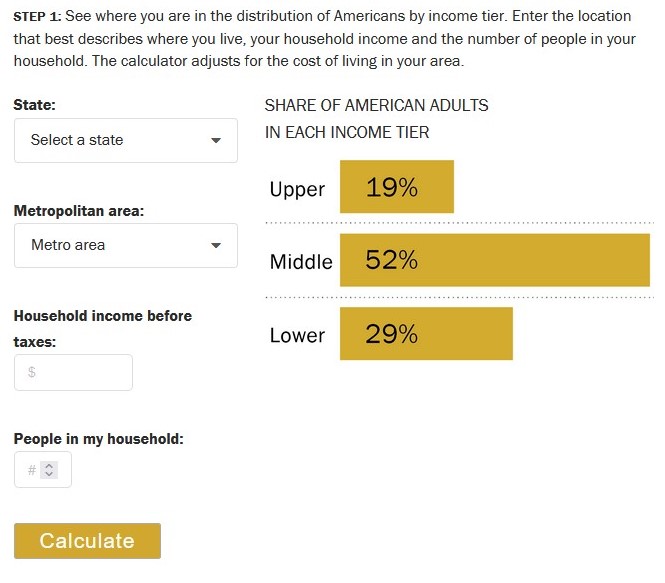
The calculator takes your household income and adjusts it for the size of your household. The income is revised upward for households that are below average in size and downward for those of above average size. This way, each household’s income is made equivalent to the income of a three-person household (the whole number nearest to the average size of a U.S. household, which was 2.5 in 2018)…
Your size-adjusted household income and the cost of living in your area are the factors we use to determine your income tier. Middle-income households – those with an income that is two-thirds to double the U.S. median household income – had incomes ranging from about $48,500 to $145,500 in 2018. Lower-income households had incomes less than $48,500 and upper-income households had incomes greater than $145,500 (all figures computed for three-person households, adjusted for the cost of living in a metropolitan area, and expressed in 2018 dollars).
The following example illustrates how cost-of-living adjustment for a given area was calculated: Jackson, Tennessee, is a relatively inexpensive area, with a price level in 2018 that was 19.0% less than the national average. The San Francisco-Oakland-Hayward metropolitan area in California is one of the most expensive areas, with a price level that was 31.6% higher than the national average. Thus, to step over the national middle-class threshold of $48,500, a household in Jackson needs an income of only about $39,300, or 19.0% less than the national standard. But a household in the San Francisco area needs a reported income of about $63,800, or 31.6% more than the U.S. norm, to join the middle class.
Key here is the idea that incomes go further in some places and have less purchasing power elsewhere. By itself, income may not be that great of a measure for determining social class. Including location helps get at local variations in class.
Of course, there are other factors that go into assessing social class. This includes education, wealth, social networks, and more.
(Note: this calculator is based on 2018 data so there could be some important changes here in 2023.)
Wyoming’s Teton County, home to Jackson Hole, has the nation’s highest per-capita income from assets, according to a study by the Economic Innovation Group. The analysis found a sharp increase in geographic concentration of asset ownership over the past decades…
It’s soared in places like New York City and the San Francisco Bay Area. Meanwhile, across Appalachia, the Deep South and much of the Midwest, it stagnated, representing a negligible source of income…
Nationwide, the county with the lowest asset income per capita is in South Dakota, home to the Pine Ridge Indian Reservation. At $2,800 per person, it’s one-third of the national average. Among the largest U.S. counties, the ones with the five lowest incomes from assets per capita are all mostly Hispanic or Black.
Only a minority of Americans holds assets beyond homes, cars and retirement savings. About 15% of households own stocks and 13% hold business equity or other residential property, according to Fed data.
First, the emphasis here on asset income is helpful compared to the more common analysis of incomes. While income may be related to assets, assets gets more at wealth or how income is converted into more long-lasting economic resources.
Second, that assets are concentrated in particular locations is not surprising but with the relatively limited number of Americans who have certain assets, this concentration is even more notable. The truly wealthy Americans have assets and utilize them in certain places, like New York City, San Francisco/Silicon Valley, and Jackson Hole, Wyoming.
With this said, how much does increasing incomes reduce the gap in wealth and assets? Or, how might efforts at local and national levels affect this gap both locally and nationally? The most exclusive locations are going to be difficult for many Americans to afford at any point, regardless of their income. While much sociological research has studied the concentration of poverty, wealth also concentrates with positive feedback loops for those who can participate.
Researchers found that when wives are the bigger breadwinners, husbands report making an average of 2.9 percent more than what’s in their tax filings. Meanwhile, women who make more than their husbands report earning 1.5 percent less than their actual income…
So why does this phenomenon happen? Researchers say they suspect societal expectations about the roles each person plays in a marriage could be a main factor.
“When married couples . . . violate the norm that husbands outearn their wives, the survey respondents reporting the couples’ earnings appear to minimize the violation by inflating the earnings of the lower-earning husbands and deflating the earnings of the higher-earning wives,” researchers wrote in their findings.
If the misreporting is due to gender norms, might we expect this to go away as more women earn more money? Already, “In about one out of four couples surveyed, wives made more money than their husbands.” Give this a few decades and this misreporting might disappear.
On the other hand, social norms can be last a long time even after society has changed quite a bit from when the social norm arose. If the misreporting continues or even increases, it would be interesting to see how the Census and other surveyors adjust their figures.