The creation of an ad hoc affordable housing committee was announced during Tuesday’s county board meeting and comes two weeks after the county board set aside $2.5 million to start an affordable housing solutions program.
“If you work in DuPage County, you should be able to live in DuPage County,” said Deborah Conroy, county board chairwoman, after announcing the committee…
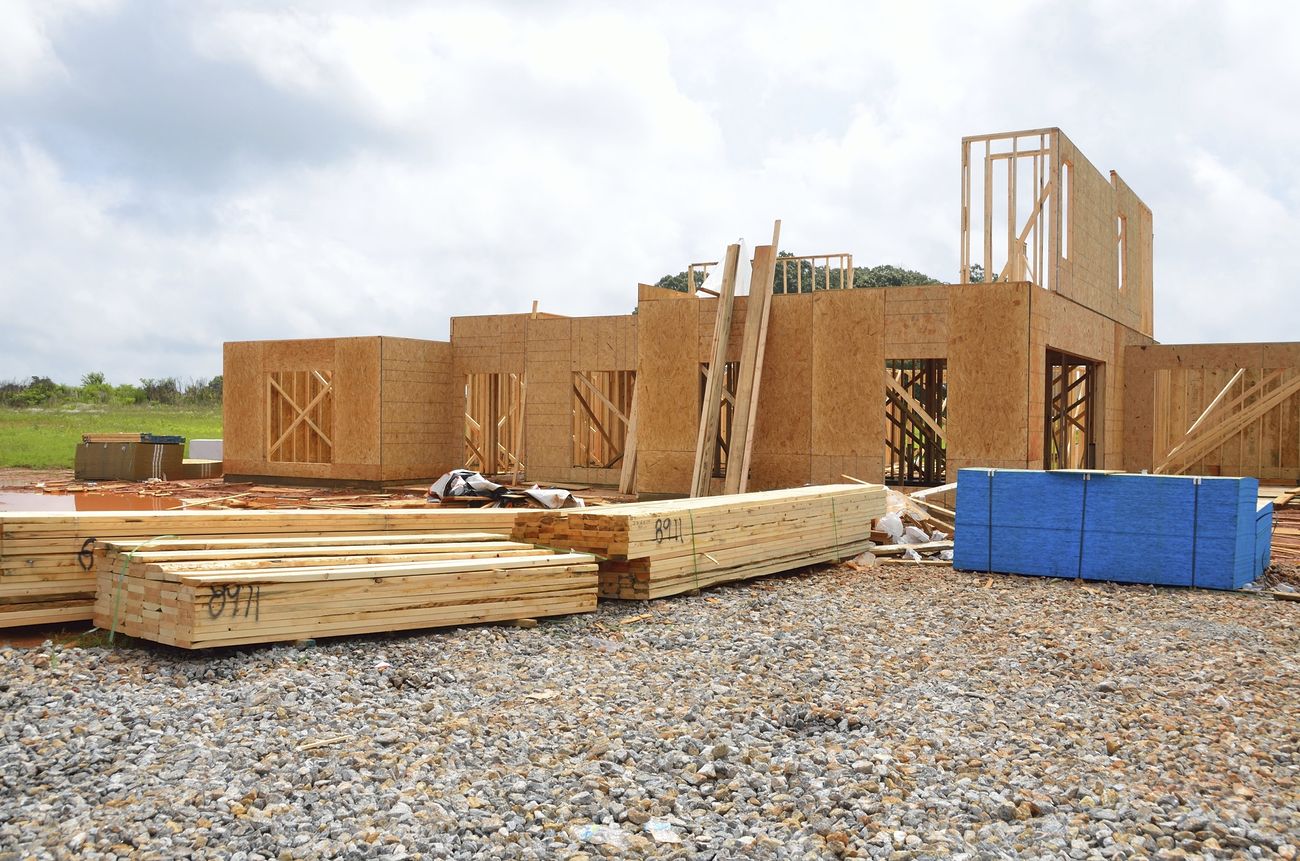
The cost of land, officials said, often hinders affordable housing developments…
From 2018 to 2022, some 862 affordable rental units were built in DuPage County, Illinois Housing Development Authority Executive Director Kristin Faust told board members Tuesday. During that same time, 996 homebuyers purchased a home with a mortgage assisted by the housing authority, Faust said.
DuPage County is a relatively wealthy county. According to the Census Bureau, the median household income is $100,292, the poverty rate is 6.9%, and the median value of owner-occupied housing is $324,900.
Additionally, the County and the municipalities within it do not have a great history of pursuing affordable housing. In the postwar era, DuPage County did not build much public housing when it had funds to do so. Municipalities largely pursued housing aimed at white, middle-class and above residents. Affordable housing has been raised as an issue in the county since at least the 1970s. Newer efforts still aim their efforts at relatively well-off residents.
By not having sufficient affordable housing in DuPage County (or in the Chicago region as a whole), the County may struggle to grow, attract workers, and continue the quality of life that residents expect.
Prairie Food will focus on local, organic and sustainably produced food. The co-op has cultivated relationships with Walnut Acres Family Farm in Wilmette, Rustic Road Farm in Elburn, Jake’s Country Meats in southwest Michigan and “quite a few dairy farms,” Kathy Nash said…
Co-op organizers say the model — local control, local ownership — has become especially relevant after the pandemic brought on food supply issues…
Food co-ops clearly define what “local” means. The Food Shed’s goal is to source 25% of all of the store products within a 100-mile radius. The McHenry County co-op purchased land on Route 14 and Lakeshore Drive to build from the ground up. The shopping space will cover around 7,000 square feet…
The Food Shed started from a desire to connect with local farmers and “tap into the local economy,” Jensen said. The co-op was officially incorporated in 2014.
If the comparison is between a 3,000 mile salad where the ingredients come from a long ways away or having food from within 100 miles or a few hours drive, then the co-op is definitely pursuing local food.
At the same time, the desire to buy local food is made more difficult in suburban settings where development has gobbled up land for decades. Looking back at some research notes I had, I found these facts about local farms:
-The amount of land in DuPage County devoted to farming dwindled toward the end of the twentieth century – down to 11% of the county’s land in 1987 and 95 farms in 1992 – according to the Chicago Tribune.
-Also in the Chicago Tribune, the last dairy farm in DuPage County closed in 1993 with the land sold to a developer. At one point, the county was known as “the milk shed for Chicago.”
-The last beef cows in Naperville left in 2005 with the sale of a farm to developers (also according to the Chicago Tribune).
So even as some suburbanites want local food, the developments and communities in which they live are at least partly responsible for pushing food production further away?
The idea has outraged many residents who believe the city is being unfairly targeted as the “garbage capital” of the Western suburbs. Citing a threat to their home values and quality of life, they say a second waste transfer station should be built elsewhere in the county or not at all because of a lack of need.
In comparison, there are more than 20 transfer stations spread throughout Cook County.
Representatives from LRS insist a second DuPage County facility — one that is state-of-the-art and environmentally sound — is necessary to maintain healthy competition with other major waste companies. Another transfer station, officials say, would reduce garbage bills for residents and bring hundreds of thousands of dollars in fees from LRS to West Chicago coffers…
West Chicago residents say they’ve already done their part with one facility in their city, and a second DuPage County station should be built elsewhere. LRS officials, however, say they’ve looked elsewhere and couldn’t find another parcel that meets zoning and setback regulations.
This is a common issue in metropolitan regions: there are certain land uses that relatively few people want to live near. Since individual communities can set their zoning guidelines and communities with money and influence can fight particular land uses, it can be difficult to find a home for these land uses.
One solution? Push the garbage transfer station outside of DuPage County to another community that might want it or will not fight it.
Another solution (unlikely in the short-term but perhaps doable in the long-run): the need for more metropolitan level planning. With all of the people and business in the Chicago region, how can garbage be dealt with on a regional level?
A third and unlikely solution: significantly reduce the amount of waste produced by residents so fewer waste transfer stations are needed.
If West Chicago residents band together enough, they can likely convince local officials to turn down this proposed waste transfer station. Where exactly the garbage will go is unclear but West Chicago residents could be happy that it will not take place in their community. However, it is going to happen somewhere…to be determined.
In 2018, independents went for Democrats 54 percent to 42 percent. Moderates broke for Democrats by a 26-point margin, and the suburbs split. In 2020, according to the national exit poll, independents went for Democrats 54 percent to 41 percent, moderates broke for Democrats by a 30-point margin, and Democrats won the suburbs 50 to 48 percent. Fox had similar results.
This year, independents went for Democrats narrowly. Moderates broke for Democrats by 15 points. And the suburbs narrowly went for Republicans in the national exit poll, while narrowly going for Democrats in the Fox voter analysis. Our national stalemate continued.
In the current state of national politics, both parties want the suburbs to break their way. It appears suburbanites were fairly split this year, meaning that not a whole lot changed. Will either party have a platform or message in 2024 that is more appealing to suburbanites than the other side?
Seeing these results also got me thinking about redistricting, gerrymandering, and how suburban areas are incorporated in districts. Given their volatility and patterns (suburbs closer to big cities lean one way, those on the metropolitan edges lean another way), do party leaders want to consolidate suburban votes or break them up? I would be very interested to see an analysis on this.
UPDATE: In at least one metropolitan region, Democrats continued to make inroads in the suburbs. Referring to DuPage County and the Chicago region as a whole:
The once-impenetrable GOP stronghold was considered purple territory in recent election cycles. But in a watershed moment, Democrats captured the county board chair seat and appeared to hold onto their board majority Tuesday.
The shift in DuPage is part of a political evolution in suburban areas. Four years after Democrats made significant gains in the region, several of the collar counties turned a darker shade of blue on Tuesday.
Democrats flipped key state House districts in the Northwest suburbs. They solidified control of the Lake County Board. The GOP has no representation in Congress from northeastern Illinois. And in DuPage, Democratic state Rep. Deb Conroy became the first woman elected county board chair.
As noted in the article, this is a significant change over the course of several decades.
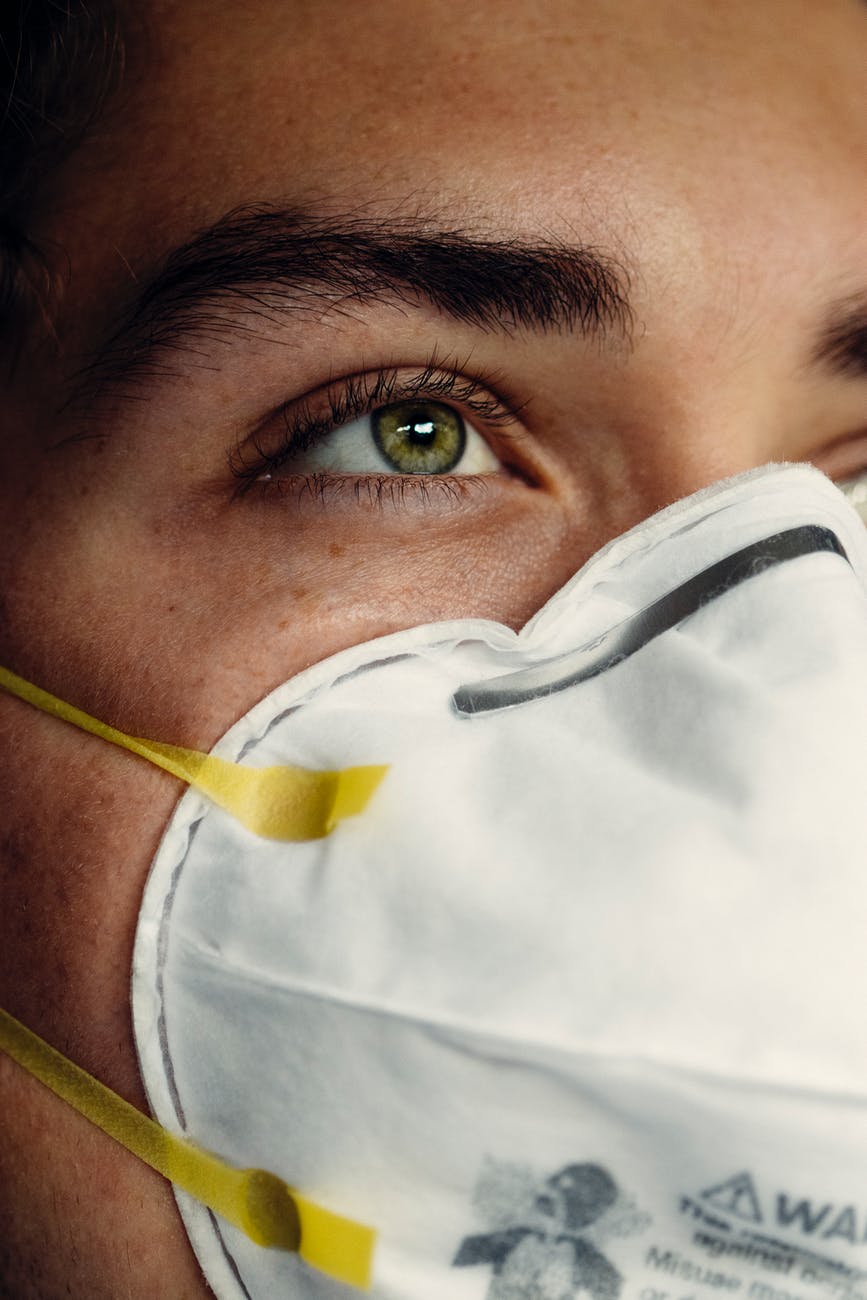
COVID-19 is big in its effects but I am surprised we have not seen more coverage all over the place about who specifically is affected more within regions and big cities. WBEZ looks at recent data in Cook County, Illinois:
In the earliest weeks of the pandemic, Chicago’s Black residents were dying of COVID-19 at alarming rates. More recently, in the few weeks since the arrival of the omicron variant, Black Chicagoans are again dying at much higher rates than their Asian, Latino and white counterparts, shows a WBEZ analysis of data on COVID-19 related deaths from the Cook County Medical Examiner’s Office.
Since Dec. 7, 2021, the date when the state’s first omicron case was found in Chicago, the city’s Black residents are dying at rates four times higher than Asians, three times higher than Latinos and nearly two times higher than white residents, according to WBEZ’s analysis. A total of 97 Black Chicagoans died of COVID-19 during the seven-day period ending Jan. 9, 2022 — more than at any point since May 11, 2020.
Black Chicagoans aren’t the only demographic that has been particularly vulnerable since the arrival of omicron. Older suburban Cook County residents have also seen their seven-day COVID-19 death totals reach levels not witnessed in more than a year. According to WBEZ’s analysis, a total of 181 suburban Cook County residents 60 years and older died from COVID-19 during the week ending Jan. 9, 2022. That’s the highest seven-day total for that group since Dec. 24, 2020…
While several communities on Chicago’s South and West sides have been hit hard by COVID-19, the pandemic’s death toll has also weighed heavily in various parts of suburban Cook County. WBEZ’s analysis finds some of the county’s highest COVID-19 death rates in parts of northwest suburban Niles, Norridge and Lincolnwood, southwest suburban Palos Heights, Chicago Ridge, Oak Lawn and Bridgeview; and south suburban Hazel Crest, Markham, Harvey, Robbins and Country Club Hills.
I am sure there are already and will continue to be many academic studies that examine these differences. Even as COVID-19 has impacted many, the impacts of COVID-19 are not distributed evenly. It arrived at a time of inequality, including in health outcomes and experiences, and it exacerbated issues.
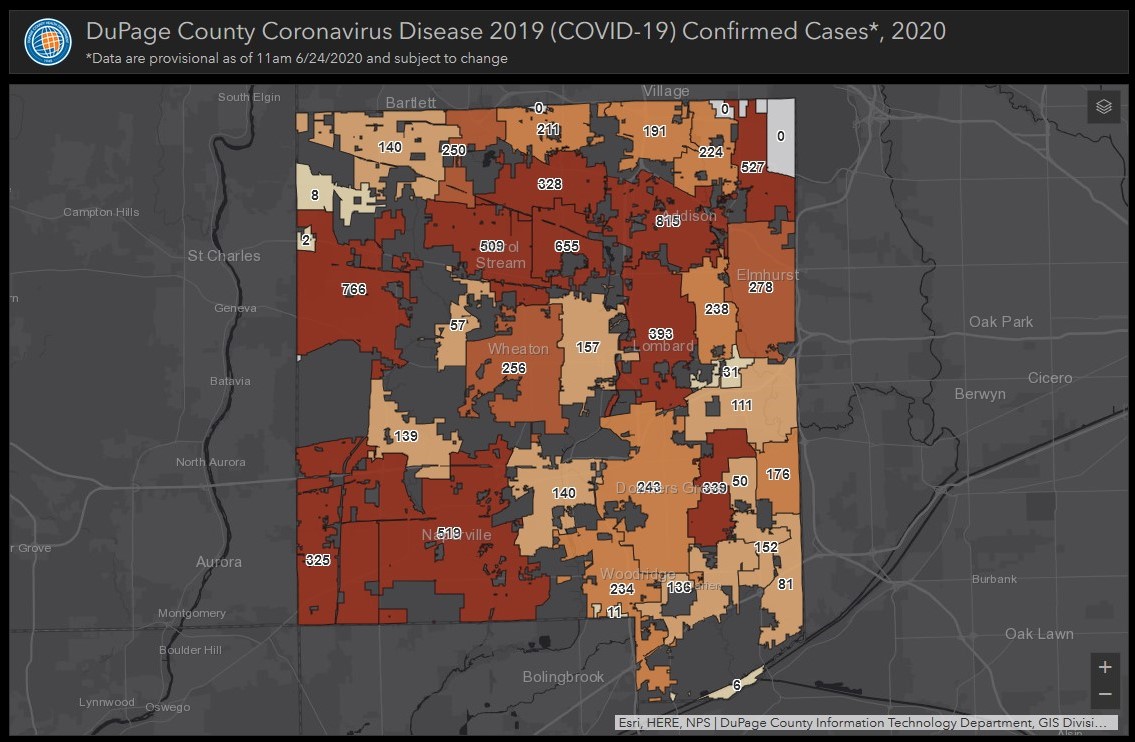
At least in the Chicago area, data on this topic is available online. For example, I have tried to keep track of the disparate effects of COVID-19 in DuPage County where there are significant differences across racial and ethnic groups, age groups, and communities (earlier post here).
After more than 35 public hearings devoted to the Haymarket project, the decision seemed almost anticlimactic. It took barely 15 minutes for board members to cast their vote. Haymarket President and CEO Dan Lustig said he wasn’t surprised by the board’s verdict.
Only Pruyn and Trustee Ellen Leahy explained their opposition, framing the decision in mostly fiscal terms. Both agreed with opponents that the scale of the proposed treatment center was too much for a town of less than 10,000 people to absorb. “A facility this large belongs at the county seat or affiliated with a hospital where appropriate emergency medical services can be provided,” Leahy said.
However, the same organization already tried to open the facility in the county seat:
From nearly the start, Haymarket faced an uphill battle in its second attempt at offering treatment services within DuPage to help combat the scourge of opioid addiction. The county last year reported 112 opioid overdoses, a record high.
Almost four years ago, Haymarket, a Chicago-based nonprofit provider, was denied a bid to start a 16-bed satellite program in Wheaton.
While such decisions may be common, the larger effect is problematic. What DuPage County community would permit this land use? When there is a need to address opioid use, where could struggling local residents and families turn?
If each suburb follows in a similar logic, this contributes to uneven development patterns. Communities with resources and organized political movements can regularly keep less desirable land uses away from them. Other communities may not be able to do the same thing or feel like they have to take advantage of any opportunity that comes their way.
Where will this treatment facility end up? At this point, any effort to locate in DuPage County may be doomed as local residents have developed multiple successful lines of argument against the facility.
DuPage County, once known as one of the most solidly Republican areas in the country, appears to have given Democrats control of the County Board for the first time since the 1930s. Two more Democrats are leading their races for countywide office, and could be joined by another when the final votes are tallied.
DuPage voters also backed Democrats in every federal race from president to U.S. representative, as well as every state senator and nine of 13 state representatives.
It’s a stunning turn of fortune two decades in the making, observers say, the result of shifting demographics, shrewd campaigning and the divisive reign of President Donald Trump.
The article above tells of recent changes in DuPage County with new residents and a desire for a new party in charge.
But, as the article also notes, this is not the first time such a shift has happened in DuPage County. I do not know much about what happened in the 1930s – I assume the Great Depression and the New Deal were involved – but I have read more about what happened in the 1850s.
This Democrat hold on DuPage politics lasted about two decades. Schmidt concludes her book with the changes that came with the first Republican party candidates in the 1856 elections.
In “Free Soil, Free Labor, and Free Men: The Origins of the Republican Party in DuPage County, Illinois,” Stephen Buck synthesizes many of the widely accepted explanations for the Republican Party’s emergence in the 1850s, including the powerful ideal of free-soil in the trans-Mississippi West; opposition to the political clout of the “Slave Power” nationally; and genuine moral commitments to the abolition of Slavery. DuPage County, in Buck’s retelling, serves as a sort of case study in the steady growth of free-soil principles in northern Illinois beginning in the 1840s. Buck finds that by the time of the Lincoln-Douglas debates in 1858, the sectional crisis was so encompassing that it deeply inscribed party identification, even in elections to town and county offices.
This work builds on Buck’s 1992 dissertation where he goes into detail regarding the changes. The issue of slavery and free soil was important in DuPage County and when the Republican Party started in 1854, it quickly attracted support in northern Illinois. In the 1856 elections, Republicans convincingly beat Democrats in local races. And this trend continued in subsequent elections.
Comparing the current shift toward the Democrat party in DuPage County to past shifts, this one seems to be longer in the making. It takes time for suburban populations to change dramatically as different communities attract different residents and national and state politics and forces interact with local conditions. Yet, DuPage residents of the future may well look to the elections of 2016 and 2020 where DuPage turned to the hands of Democrats.
Discrimination takes so many different forms. It’s not as apparent as it once was decades ago. The wrongdoers have become better at this sort of illegal activity. You will see it taking the form of lying about the availability of housing or home loans or home insurance, or applying a no-pets policy on service animals. You will see discrimination in the way of illegal steering. So when a prospective tenant wants to look at one apartment, the company showing the apartments says, “No, no, you really want to look a few blocks over; that’s where you really want to go.” A lot of people do not know their rights and they do not realize that this is what’s occurring. Another form it takes is offering different terms or conditions to members of a protected class, such as requiring sex in exchange for rent.
You see discrimination in the form of constructing inaccessible buildings — that’s a big one, too. A lot of the cases that we have pending and a lot of the work we do from a previous settlement, is we make improvements to make housing accessible to people with disabilities.
Another form of discrimination is saying, “No children allowed,”bwhich to me is like a stake straight at my heart. I grew up with my abuelita, my great-grandparents. I mean, there were a lot of us in one household and a lot of children. But the wrongdoers also find a way of making sure children are not allowed. Well, children need to live somewhere.
This sort of discrimination is often quietly done and scattered across locations. It rarely comes up in the news. It may be hard for people to guess how often it happens. The people affected by it may not know how to fight back or bring the issue to light.
Some of the issue might be defining fair housing. Sanguinetti explains the concept:
There’s always this conclusion that goes on with a lot of people like, “Fair housing? Free housing! That’s cool.” And I’m thinking, “No, no.” The Fair Housing Act provides that if you have the resources to live where you want, but you’re being prevented from doing so because you’re a member of a protected class, that’s illegal.
I imagine some might confuse fair housing with affordable housing which is often about providing housing for those who do not have the resources to live in a place. If we do not have a foundation of fair housing, it would be even harder to make the case for affordable housing – which is hard enough in many suburbs.
At the same time, efforts which help ensure fair housing do not necessarily help with getting residents resources (jobs, income, wealth, connections, etc.) that would help them access housing). Fair housing addresses the housing side once people try to acquire housing. Work is also needed on the other end in helping people get to a point where they can have housing choices that help them meet their goals.
See how the Census Bureau calculated the risk here.
Several thoughts on the map:
1. There are some patterns. Many counties in the Northeast, Midwest, and Mountain West having lower levels of risk (outside of urban counties). In contrast, the Sun Belt and the West Coast are at higher risk.
2. Doing this at the county level makes some sense: people might travel within a county for work, errands, and other activity. At the same time, there could be significant disparities across communities within counties that a map like this covers up. For example, it looks like DuPage County is somewhere in the middle and some suburbs there have higher rates of cases than others.
3. The differences across geographies also speak to the difficulties of enacting policies across different areas. On the risk map, some states have more consistent patterns while others have a mix (ranging from more equal numbers of counties at different levels or a few heavily populated counties versus everyone else). National policies have to address places with different experiences and different futures.
4. This data cannot tell us how many people cross county lines within a region or state. There are clusters of counties with similar risk levels but this may not speak much to travel as to similar populations.
Just looking at the map and knowing about population distributions in DuPage County, there are both more cases and higher rates of cases in certain communities: Addison, West Chicago, Glendale Heights, Carol Stream, and Bensenville. These are communities with more diverse populations.
Data from the dashboard also look at rates by ethnicity and race:
The case rate for Latinos is 5.5 times that of whites though the Latino mortality rate is slightly lower. The case rate for Blacks is 2.1 times that of whites and 1.7 times that of Asians and Black mortality rates are higher at similar amounts. Further data breaks this down by ethnicity and age and race and age with case rates being much higher for Latinos and Blacks among those 60 and older (and rates are higher at all adult age groups).
Put these together and COVID-19’s impact on DuPage County depends on race, ethnicity, and location. This also probably means COVID-19 has some connection to social class since DuPage County communities, like many metropolitan regions, have different levels of income and housing costs.