What if housing prices were so high in some American markets that a regular way people acquire homes is through inheritance? Take the case of California:

About 18% of all property transfers in the state last year, representing nearly 60,000 homes, were made through inheritance, according to a recent analysis by real-estate data firm Cotality.
That share is a record for California in data going back to 1995, up from 12% in 2019. It is also roughly double the national share of 8.8% last year…
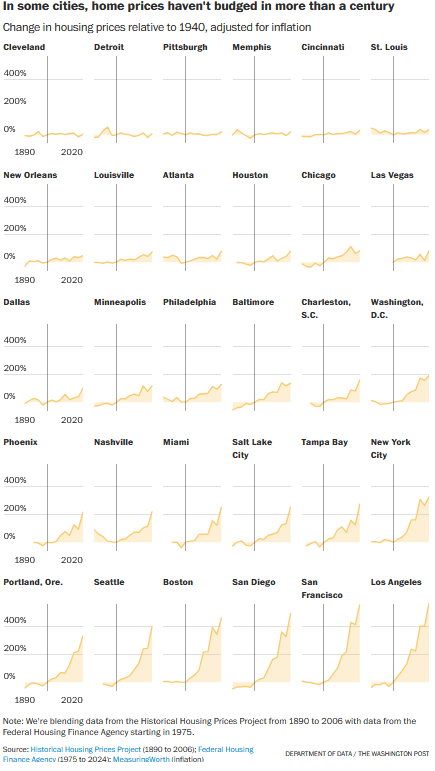
The state’s high rate of inherited homes reflects California’s unique circumstances: years of skyrocketing home prices, and tax policies that encourage owners to avoid selling their houses before they die.
The people who inherit these houses enjoy tremendous benefits. They can move into homes that they otherwise might not be able to buy at current prices, or they can sell them and keep the proceeds without having to pay capital gains taxes.
But the high rate of homes passed on after death is distorting the state’s housing market, favoring longtime homeowners and their families over all other home buyers.
The postwar idea of suburban homeownership included social mobility, the idea that someone could work hard and purchase their own house and plot of land. Follow the American pathway to success and it would end in homeownership.
But what if this does not always work out? Or if conditions in some places mean that the typical path does not work for a good portion of people? This postwar expectation was not necessarily available to everyone even then; communities and programs were not open to people of all races and nationalities.
The California case is one where observers can see that this social contract of homeownership is or is not working. Can a regular worker or household find a home in California? Wasn’t a lot of California’s growth due to this postwar social contract? In the American social and economic system, is inheritance a preferred or a good way to obtain a home?
It also remains to be seen whether the trend in California becomes the norm in other American settings or whether it is an isolated case with a unique housing market.