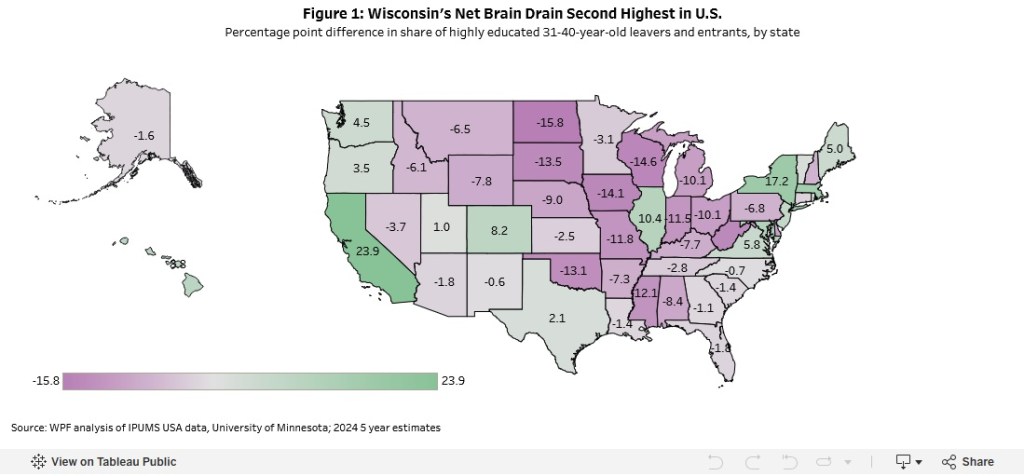
Wisconsin’s net brain drain ranks second nationally, behind only North Dakota (see Figure 1). This is a slight improvement from 2009, when Wisconsin’s net brain drain (-15.3 percentage points) was the highest in the nation. Most other Midwestern states have experienced similarly high rates of net brain drain, with the exception of Illinois, which stands out as the region’s only net “brain‑gain” state (+10.4 points). Nationally, a few other states with strong metropolitan hubs — such as Virginia (+5.8 points) in the Southeast and Colorado (+8.2) and Utah (+1.0) in the West — defy regional brain‑drain trends…
While brain drain measures the educational gap between movers and entrants, it does not account for the volume of people moving. A state may lose more highly educated residents than it gains, but the impact is far greater when large numbers of people are leaving, especially when the state has a less educated population to begin with.
This dimension is captured in Figure 4, which compares each state’s net brain drain rate against its cumulative domestic migration rate from 2020 to 2024 using data from the U.S. Census Bureau’s Population Estimates Program. Domestic net migration reflects only movement of U.S.-born adults — regardless of age — between states; it excludes births, deaths, and international migration. To help interpret these patterns based on a state’s educational foundation, Figure 4 also groups states by the educational level of their birth cohort—high, middle, and low terciles—based on our brain drain analysis.
Three quick thoughts:
It appears that the national map shows patterns: states with large and vibrant cities and metropolitan areas draw educated residents (think Boston, New York, Washington, D.C., Chicago, Houston, Dallas, Austin, Denver, Seattle, Portland, the Bay Area, and Los Angeles). It would be interesting to see this map by metro area rather than by state as there are likely differences within many states.
It would not be a big leap to go from this data analysis to an argument that cities and states should work even harder to attract young professionals or “the creative class.” How might this fit with efforts to serve and provide opportunities for current residents?
These figures reflect a dynamic context. Americans are less geographically mobile than earlier in the postwar era. Work from home opportunities are more plentiful for educated employees. Travel is relatively easy compared to the past. At the same time, cities and industries and cultural opportunities continue to cluster in particular places, attracting people and resources. How might this all affect brain gain and drain in the coming years?