William Frey at Brookings details population changes in American metropolitan areas:

Clearly, migration dynamics have played a huge role in big cities’ roller coaster of population shifts over the past five years. Analyses of state and metropolitan area population changes over this period have highlighted the importance of domestic migration (movement within the U.S.) in shifting movement from coastal and Midwest states to the South and parts of the West during the peak pandemic years, only to have that movement pull back in the past few years. What’s more, it was international migration that led to both upward growth in many areas (as net immigration to the U.S. rose sharply through 2023-24) as well as later declines (as federal policies curtailed immigration in 2024-25)…
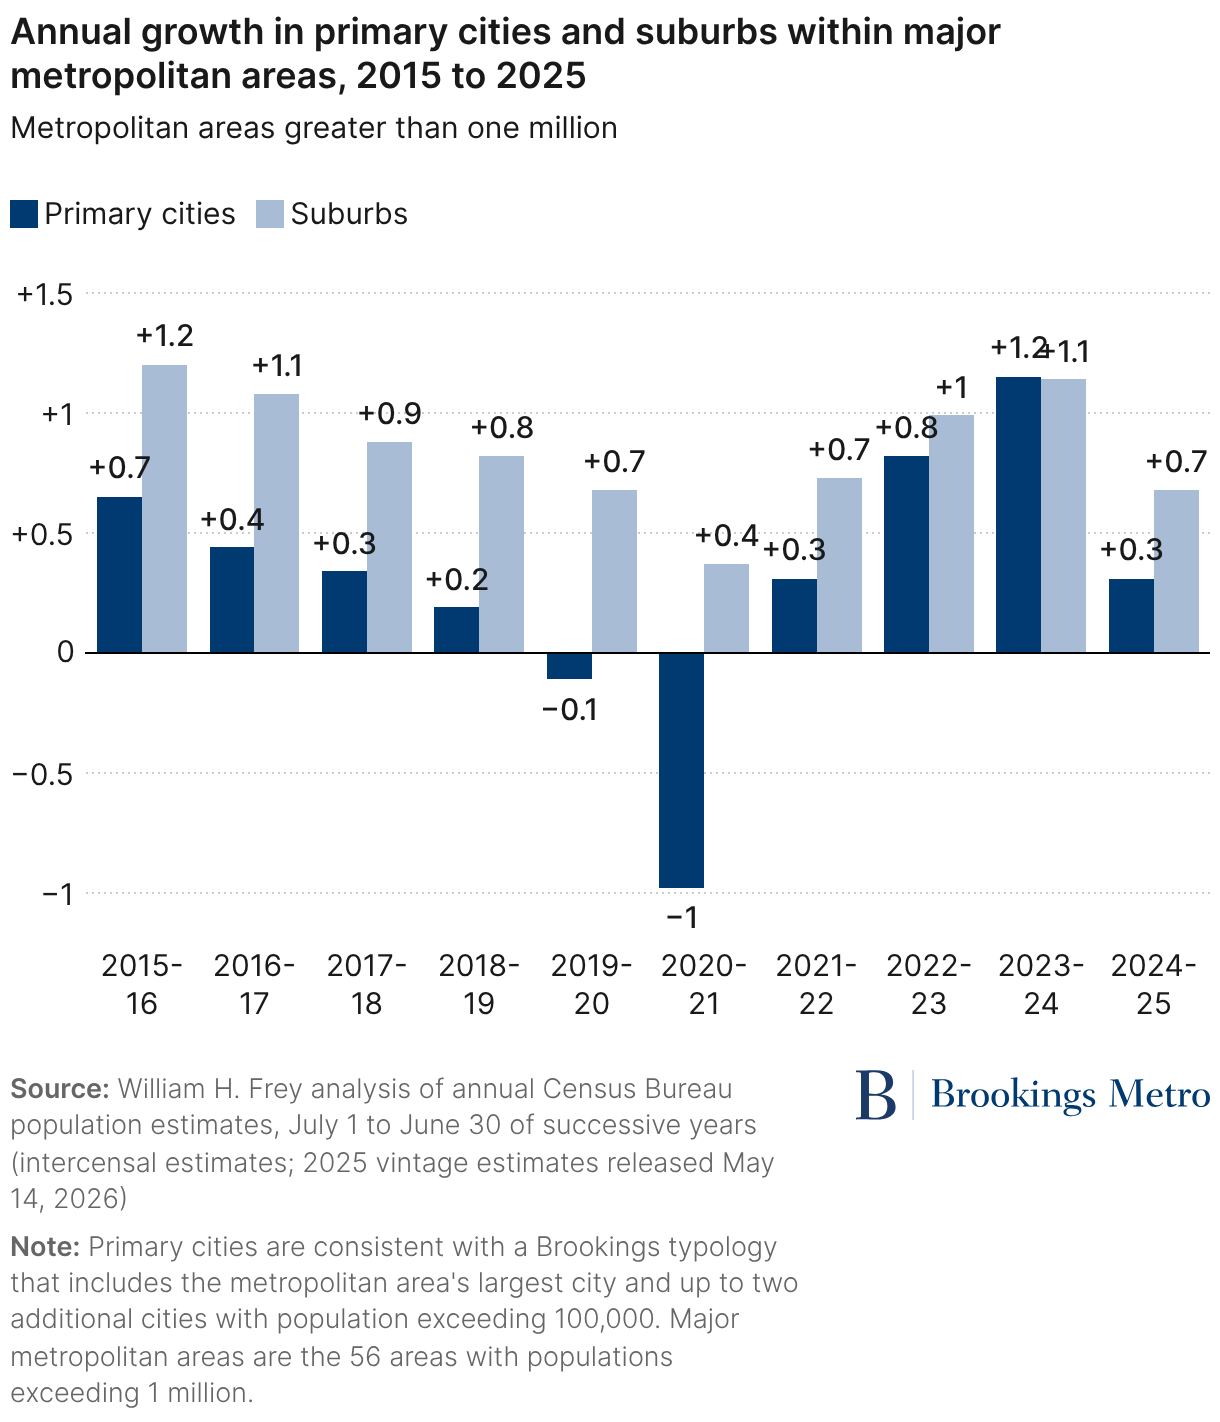
In the peak pandemic year of 2020-21, there was a sharp decline in the combined primary city populations of these metro areas, while the suburban portion of these areas exhibited positive growth, albeit smaller than in prior years. (In fact, these large metro areas, as a group, registered an absolute population decline during this year.)
Since then, both primary cities and their suburbs, in the aggregate, have registered population gains, with the former making greater strides so that their 2023-24 growth exceeded those of their suburbs. What’s more, 21 of the 56 metro areas exhibited primary city growth that was higher than suburb growth. This was true in metro areas such as New York, Los Angeles, Chicago, Washington, D.C., Miami, Detroit, Seattle, and Pittsburgh (see downloadable Table D).
Of course, in 2024-25, as big city and large metro area growth slowed, the primary cities of these major metro areas showed sharp population declines that were greater than that of their suburbs—though most individual primary cities as well as suburbs experienced growth slowdowns or shifts to losses. Still, primary cities took the greater hit and, among the 56 major metro areas, primary cities in 40 of them saw greater growth slowdowns than their suburbs, and primary cities in just 14 of them grew faster than their suburbs.
Reading through the details in this report, I am struck by two features:
- We have data on metropolitan populations (estimates) at a year to year level.
- Tracking population changes over time – year to year – show changes and variation.
Looking across places and times allows for considering causes of the patterns. Frey notes multiple forces affected US metropolitan areas including the COVID-19 pandemic and changes to immigration policies.
It might be harder to know exactly how much these social, political, and economic changes contributed to the population changes versus what we might expect to see year to year. Population growth or decline in major centers can be helpful to look at in a longer historical view. Did changes due to COVID-19 represent a blip or were they part of larger patterns? Immigration policies might lead to longer-term changes even as policies can be changed (by a new administration? By a later administration? Not at all?) I am thinking of the scholarship looking at how many major legislative and policy shifts in the US regarding immigration in the 1920s and then in the 1960s affected American communities.
Put all the data and possible causes together here and it looks like growth has slowed in many American cities and suburbs in recent years. What could American metropolitan areas look like in a decade or two if they have no to little growth? In a country where (population, economic, technological, etc.) growth is good, this could be interesting.