More colleges in places with higher costs of living

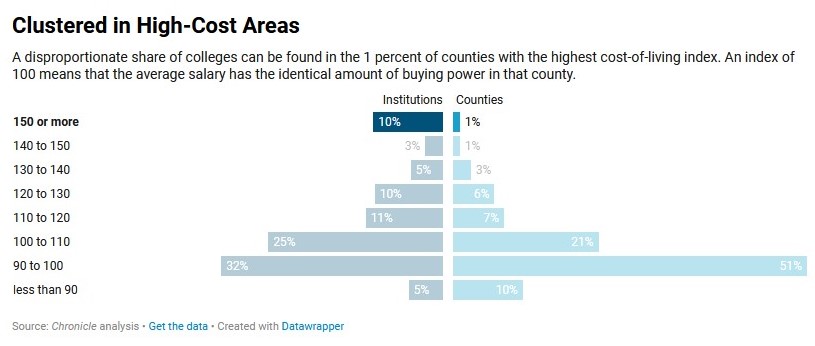
Where do colleges tend to be located? This graph in The Chronicle of Higher Education uses one metric:

Two quick thoughts in response:

  1. Does the presence of these colleges over time help contribute to a higher cost of living? I am reminded of Richard Florida’s argument about the creative class. If I remember the analysis correctly, places with colleges tend to have higher percentages of creative class residents. And he suggests colleges and universities can help attract people and development.
  2. When Ben Norquist and I looked at the locations of smaller Christian colleges, we found they tended not to be in the biggest cities (which account for some of these higher cost of living places). In contrast, research schools are often in big cities according to the article: “Almost a third, or 32.2 percent, of colleges in The Chronicle’s analysis were in counties where cost of living was at least 15 percent higher than the national average. The types of institutions found in these expensive regions tended to vary. About 10 percent of doctoral-granting universities and 23 percent of four-year special-focus institutions (like those specializing in health professions or religious training, for example) are in the priciest 1 percent of the nation’s counties, where the cost of living is more than one-and-a-half times the national average. In contrast, nearly half of associate- and bachelor’s-granting institutions were in counties with below-average costs of living.”
  3. The other category with a larger percentage discrepancy is among the percentage of institutions in counties at 90 to 100 in cost of living.

The cities college graduates are leaving, the cities college graduates are going to

A new analysis suggests college graduates are leaving some of the costliest metropolitan areas and instead moving to other metropolitan areas:

Looking at these two lists, several things stand out:

  1. Among the most expensive cities, not all have turned negative regarding college graduates moving in or out. What is different in Boston, Honolulu, Miami, San Diego and Seattle? (Some possible factors: different economic activities, the weather, relative prices, their locations within certain regions, they are not the biggest cities.)
  2. Some of the 41 other large metros are clearly more attractive than others for college graduates. This includes Atlanta, Austin, Charlotte, Dallas, Denver, Houston, Jacksonville, Las Vegas, Nashville, Phoenix, Portland, Raleigh, San Antonio, and Tampa. The Sunbelt continues to grow? Will these population changes in these cities change the conditions within these cities? Are these the current hot places to be (subject to change)?
  3. Other large metro areas might have cheaper housing and lower costs of living but they are not necessarily attracting college graduates. This includes Buffalo, Detroit, Hartford, Milwaukee, and Rochester. Is it a coincidence that these are Rust Belt metropolitan regions?

Generally, cities and regions want college graduates who can add to the population and the human capital available. But, the sorting of the college graduates across locations could have profound consequences.

Pew Research calculator to determine your location-controlled social class

This calculator offered by the Pew Research Center factors in your location to determine which social class you belong in:

On how the calculator considers location:

The calculator takes your household income and adjusts it for the size of your household. The income is revised upward for households that are below average in size and downward for those of above average size. This way, each household’s income is made equivalent to the income of a three-person household (the whole number nearest to the average size of a U.S. household, which was 2.5 in 2018)…

Your size-adjusted household income and the cost of living in your area are the factors we use to determine your income tier. Middle-income households – those with an income that is two-thirds to double the U.S. median household income – had incomes ranging from about $48,500 to $145,500 in 2018. Lower-income households had incomes less than $48,500 and upper-income households had incomes greater than $145,500 (all figures computed for three-person households, adjusted for the cost of living in a metropolitan area, and expressed in 2018 dollars).

The following example illustrates how cost-of-living adjustment for a given area was calculated: Jackson, Tennessee, is a relatively inexpensive area, with a price level in 2018 that was 19.0% less than the national average. The San Francisco-Oakland-Hayward metropolitan area in California is one of the most expensive areas, with a price level that was 31.6% higher than the national average. Thus, to step over the national middle-class threshold of $48,500, a household in Jackson needs an income of only about $39,300, or 19.0% less than the national standard. But a household in the San Francisco area needs a reported income of about $63,800, or 31.6% more than the U.S. norm, to join the middle class.

Key here is the idea that incomes go further in some places and have less purchasing power elsewhere. By itself, income may not be that great of a measure for determining social class. Including location helps get at local variations in class.

Of course, there are other factors that go into assessing social class. This includes education, wealth, social networks, and more.

(Note: this calculator is based on 2018 data so there could be some important changes here in 2023.)

Survey data on wealthy New York City residents thinking about leaving the city

New survey data looks at what New York City residents making more than $100,000 think about leaving the city:

We found that 44% of high-income New Yorkers say that they have considered relocating outside the city in the past four months, with cost of living cited as the biggest reason. More than half of high-income New Yorkers are working entirely from home, and nearly two-thirds believe that this will be the new normal for the city…

Of those considering leaving New York City, 30% say that the possibility of working remotely makes it more likely that they will move. Of New York City residents who earn $100,000 or more annually, 44% have considered moving out of the city in the past four months (see Figure 4). Looking ahead, 37% say that it is at least somewhat likely that they will not be living in the city within the next two years…

The cost of living, more than any other factor, contributes to the likelihood of leaving New York City (see Figure 5). A total of 69% of respondents cite cost of living as a reason to leave the city; that figure is even higher among black (77%) and Hispanic (79%) respondents. Other reasons cited by respondents considering leaving New York City include crime (47%), desire for a nonurban lifestyle (46%), and the ability to work from home (30%)…

Only 38% of New Yorkers surveyed said that the quality of life now was excellent or good, a drop by half, from 79% before the pandemic (see Figure 2). Most believe that the city has a long road to recovery: 69% say that it “will take longer than a year” for quality of life to return to normal.

Finally some data on New Yorkers leaving the city! (Of course, this is more about attitudes than actual behavior.)

If I am interpreting the data above correctly, it sounds like COVID-19 has brought some other issues to light. This includes:

(1) If I can work remotely, do I value city life enough to stay there even though I do not need to be close to work?

(2) If the city is not what it was – and it is not clear when it might return to normal – because of decreased social activity due to COVID, the cost of living may not be justifiable.

Ultimately, is it worth living in a global city – with all that comes with it for high earners including jobs, cultural amenities, and a high cost of living – when the positive features of this city are muted during a pandemic?

Will a major need for affordable housing lead to population gains in less desirable places?

As I read another story the other day about a need for affordable or reasonably priced housing – this time for aging baby boomers – it led me to a hypothetical question: would people move to less desirable locations if housing there was significantly cheaper? Many Americans have retired to cheaper locations that also have other amenities like nice weather (think Florida and Arizona). But, would they move to cheaper suburbs within a metropolitan region that perhaps has a lower quality of life or move to a new state that is cheaper but less glamorous (think a move from the Chicago region to Kansas or Youngstown, Ohio)? In other words, would they trade fewer amenities for cheaper housing? Is cheap housing so big of an issue that many people will move to acquire it? Conservatives argue that people should vote with their feet. And the continued population gains of the Sunbelt suggest that they do, to some degree. But, people have particular ideas about what they expect when they move. For retiring, they often want to go somewhere warm. For affordable housing, they want to go to nice communities.

These desires strike me as normal in our society: people want a nice yet affordable place to live. However, is this possible? Does the movement of people to particular locations drive up prices and long-term costs (providing a higher quality of life has to be paid for by someone)? In the end, can you really have it all: an affordable place to live but with great care or nice amenities or a high quality of life? Maybe not.

Imagine affordable housing is such an issue in the Bay Area that a large group of retirees decides to move to a small town in North Dakota. With the money made on the sale of their homes in the Bay Area (or the large rents they save), they have money left over to both save for the future and put into the local community. Granted, North Dakota doesn’t have the same kind of life as the Bay Area – no major city, different weather and topography, and social connections left behind – but the housing is certainly cheaper and the anxiety about day to day existence might be reduced. This might sound far-fetched outside of some odd religious group…but if housing is such a need, why couldn’t it happen?

Purchasing a home in 25 different American cities

Here is a quick look at the estimated incomes it would take to buy a home across American cities:

HSH Associates, a New Jersey-based publisher of mortgage industry data, took a stab at what it would take, incomewise, for buyers in 25 metro areas to be able to purchase a median-priced home, based on the demands of principal and interest payments.

Coming out on top (or on the bottom, depending on how you look at it): Cleveland, with an income of just $22,348 needed to put a set of house keys into your palm…

In calculating its ranking, HSH took the National Association of Realtors’ third-quarter median home price data, as well as its own figures on average interest rates for 30-year, fixed-rate mortgages, to estimate what homebuyers in 25 major metros would need to earn to purchase the median-priced home, he said…

At the top of the expense range was San Francisco, with an income of $125,072. Skipping around the middle of the list, HSH pegged the base line salary for Chicago at $37,078 (11th place); Minneapolis, at $37,115 (12th); Baltimore, at $46,623 (16th); Seattle, at $63,145 (19th); and New York, at $71,255 (22nd place). The full list is at hsh.com.

Quite a difference across cities. There are a lot of factors involved here including the availability of housing, the quality of housing, jobs available in the metropolitan regions, and incomes. Even then, there are huge differences within specific regions.

While these figures aren’t surprising, it is also a reminder of the difficulty of making cost-of-living calculations for the entire United States. On one hand, it might seem obvious to adjust for region or city because of the big differences in housing costs, which typically comprise a sizable amount of expenses. On the other hand, people do have some ability to move so they aren’t necessarily locked in to certain expenses. Yet, the ones who can best weather these cost-of-living differences are already wealthier and have more options.

The high costs of living in suburbia

Via Yahoo! Finance, the New York Times looks at the costs of living in the suburbs vs. living in the city. The verdict: unless a family is sending kids to private school (particularly at middle-school age and above), the suburban life costs about 18% more.

The basis for the analysis – and Manhattan is not part of the figures:

While our analysis was by no means scientific, our goal was to recreate the type of decision a hypothetical family of four earning $175,000 a year might encounter. We chose an upper-middle-class income because that’s generally what our family needs to earn, conservatively, to afford a median-price home in Park Slope, a section of Brooklyn that is family-friendly, has good schools and is generally more affordable than Manhattan.

The two-bedroom, one-bathroom co-operative apartment that we’re using as a model in Park Slope is listed at $675,000, close to the median price for the neighborhood, as calculated by Zillow.com.

We stacked that against a four-bedroom, two-and-a-half bathroom home in South Orange, N.J., just a 30-minute train ride from Manhattan, where the two parents work. The house is selling for $595,000.

Some experts have been talking a long time about the hidden costs of suburbia due to more driving and sprawl. Homes may be cheaper (and bigger) but there are added costs from lower density living.

If homeowners were presented with this sort of evidence (assuming it would hold up across cities), would they chose the suburbs in lesser numbers? Or would people still be willing to pay a premium for the amenities that suburbia can offer?