The city conducted a survey in the fall to gather data on commuting habits and gauge when people expect to return to work. The information will be used as the city reevaluates the Commuter Parking and Access Work Plan instituted in 2019…
A survey shows 81% of respondents are not commuting, but 75% indicated they expect to return to their “pre-pandemic schedule for commuting by Metra” by the end of 2021…
The survey shows 1,642 respondents, or 76%, said they commuted on Metra four or more days per week before the pandemic. But 37%, or 797, said they expect to continue commuting four or more days when life gets back to normal…
When people do return to a regular commute, Naperville’s parking survey showed 69% of responders would like the city to consider other payment options beyond quarterly and daily fees.
Trying to forecast commuting via multiple means – train, car, bus, subway, etc. – is going to be difficult for a while. As the article notes, a work from home option from many employers could continue. The willingness of commuters to return to mass transit and regularly proximity to others also might matter (and more of those who return to the office might choose driving which leads to other problems).
Yet, even if ridership or commuting stays low, systems still need to run and be maintained. With less revenue, how do transportation systems and municipalities keep up with costs?
This can contribute to an ongoing chicken-and-egg problem often posed in the United States. If there was better mass transit, would this lead to increased use? Or, do you have to have increased ridership or interest before building out transit systems?
The effects could be broader than just infrastructure and local budgets. Populations might shift if people change their commuting patterns for the long-term. Workplaces and offices could be very different. Suburbs, already built around private homes and lots of driving, could change in character and land use.
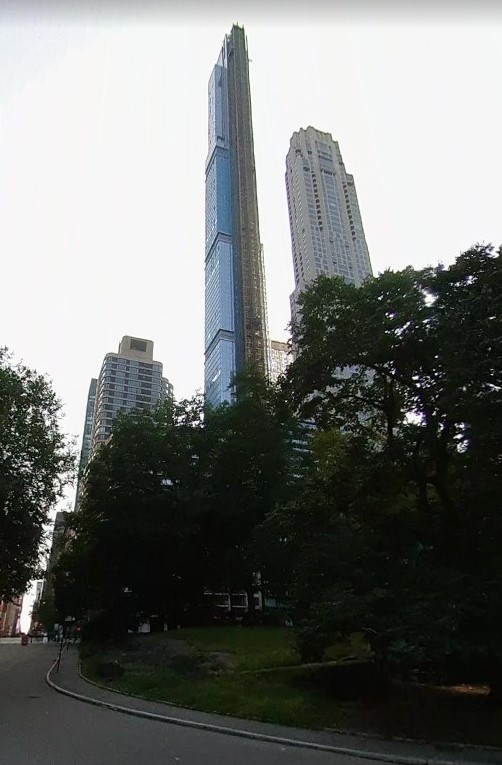
Google Street View image of 220 Central Park South(September 2020)
By the end of September, the volume of Manhattan co-op and condo sales was down 43% year over year, according to a report by Douglas Elliman, as sellers held back from listing their apartments and buyers increasingly gravitated toward the suburbs…
Of the top 10 national sales compiled by Jonathan Miller, president and chief executive officer of Miller Samuel appraisers, five were in 220 Central Park South, a new luxury tower on Central Park designed by architects at Robert A.M. Stern…
Another trend from this year, namely rich people “fleeing” New York for Florida, didn’t manage to trickle up to the highest tier. Only two of this year’s top 10 sales were in Palm Beach; last year there were three…
Even the three Los Angeles entries diverge slightly from conventional 2020 narratives. Yes, the L.A. market is one of the few urban bright lights this year, with sales soaring and inventory hard to come by. But numbers at the very top are down from last year, when it notched four entries in the top 10, totaling $463 million. This year there were three, totaling $293 million.
The actions of the wealthiest homeowners matters not only because people often have an interest in what those who have lots of money do with all that money; it matters because these are people with clout and influence. If they are continuing to purchase in New York City – it is less clear how much time the owners would necessarily spend in the city – it is a sign of the importance of the city and the prospects for future development.
The optics of 2020 might not be favorable to the list above but the project and the trends were underway far ahead of COVID-19. In a very expensive land and housing market, purchasing a residence in one of the newest buildings and in such a location within Manhattan is an object of desire for some who have the resources to purchase such places. While a figure later in the article notes that the total price for the properties on this list is lower than the price for the properties the year before, this may only allow the wealthiest to get into hot markets even more.
It may (or may not) be worth noting that five of the ten properties are in a tower in New York City while the other five properties are large homes on some land. On the whole, Americans as a whole tend to prefer or idealize single-family homes but the wealthiest in the United States and elsewhere may be more inclined to purchase large units in multi-unit buildings.
Estimates for the nation’s total rent shortfall on Jan. 1 range in the tens of billions of dollars, potentially exceeding the amount of emergency rental assistance that Congress may or may not deliver over the next few weeks. If lawmakers fail to act, the New Year could trigger a long-feared disaster — an avalanche of evictions during the dead of winter, as the pandemic rages.
Back rent owed by struggling U.S. households — about 11.4 million renters in all — averages about $6,000 per household, or around three-and-a-half months’ rent, according to Mark Zandi, chief economist for Moody’s Analytics. Most of it has accrued since the expanded unemployment benefits under the CARES Act expired over the summer.
“These are low-income households,” he says. “They’ve probably already borrowed as much as they can from family or friends. They have no resources left.”…
The National Council of State Housing Agencies commissioned its own report on the nation’s overdue rent, arriving at a figure of $34 billion back in September. Stout, the global advisory firm that produced the report, has since issued a biweekly report on households facing eviction, drawing on data from the Census Bureau’s American Community Survey and its weekly Household Pulse Survey. Stout’s tracker currently estimates that 7–14 million households will face eviction for nonpayment in January, with rental arrears totaling between $13–24 billion.
Even if COVID-19 ended tomorrow or the vaccine is quickly distributed, administered, and effective, this is a lingering effect that will take a long time to work through. It will affect renters, landlords, other actors in the real estate market (including lenders and investors) as well as communities if there are unpaid bills and/or people left without housing.
Even as the media coverage of this issue might focus on certain housing markets, the effects could stretch across many markets. Imagine the priciest markets: with high rents to start, how can people make up the money if they do not have jobs or the same income or how could they easily find housing? But, the cheaper markets may run into similar problems: if you cannot afford to pay back rent, how many cheaper housing options or replacement housing options could people find? Given the possibility of regional differences, this might mean more local units of government – states, municipalities – could provide different options that better address local circumstances.
More broadly, this hints at ongoing housing issues that seem to get little attention. Housing is a foundational, daily issue for many and COVID-19 just exacerbates existing issues. Relief money from the federal government may provide temporary help but housing costs and quality need attention in many places.
A list of the most deaths on a single day has been making the social media rounds. Titled “The Deadliest Days in American History,” spots #4-7 are recent days with COVID-19 deaths following the Galveston Hurricane, the battle of Antietam, and September 11, 2001. But, the numbers on the list are not what they seem:
I first saw the image on Facebook.
For one thing, a list of the “deadliest days” in American history would include days with the most deaths, not the most deaths from one discrete event. On all of the days included, more people in the United States died than the numbers listed. According to Reuters, 2,861 COVID-19 deaths were indeed reported last Thursday. But that doesn’t account for the number of people who died from heart disease (last week’s daily average was 1,532 deaths), lung and tracheal cancer (last week’s daily average was about 560 deaths), or chronic kidney disease (last week’s daily average was about 290 deaths). Deaths from drug overdoses have also been reaching record highs this year, a trend that may have been worsened by the pandemic. (Obviously, more people died on the days of the Galveston hurricane, the Battle of Antietam, 9/11, and Pearl Harbor, too.)
By its own rules, the list is also incomplete. More than 3,000 people died in the 1906 San Francisco earthquake, which isn’t mentioned, nor is the 1899 San Ciriaco hurricane, which killed more than 3,300 people in Puerto Rico over the course of six to nine hours. While we’re at it, the population of the United States is much larger now. The U.S. was home to about one-tenth of the current population during the Battle of Antietam. Losing 3,600 people back then would be like losing 36,000 people now.
But yes, the general idea behind this list—and other attempts to communicate the horrors of the pandemic as a set of digestible facts—is worthwhile. It can be helpful to compare the number of deaths specifically from the coronavirus to other historical events in which there were huge losses of American life. More than 286,000 people in the U.S. have died from COVID-19 thus far. Compare that to the 116,000 Americans who died in World War I; 405,000 Americans who died in World War II; 37,000 Americans who died in the Korean War; and 58,000 Americans who died in the Vietnam War. The 1918 flu pandemic killed 675,000 Americans, the 1968 influenza A pandemic killed 100,000 Americans, and the 2009 H1N1 pandemic killed 12,469 Americans.
The general idea may be a good one: similar numbers reported day after day lose their power. It can be hard for the general public to interpret large numbers in the abstract, as this earlier post about comparing an earlier death figure from COVID-19 to my community’s population. The list tries to place the daily death totals in historical context by noting that these are not just normal numbers; they are high numbers for any day in American history.
Yet, as noted above, the numbers do not quite work out. Perhaps the list should have a new title like “Days with the most deaths directly attributable to unusual causes” since it ignores all causes of death on particular days. And even then, other natural disasters are ignored and putting the numbers in a different context – as a percent of the population as a whole – also changes the list.
The list might still spur people to action, even if the list has flaws. And this was probably the goal of the list in the first place: it is not meant to be an academic study on the topic but a call to action. Like many statistics, these numbers are used in a way intended to nudge people toward different behavior.
Nearing the ninth month of COVID-19 restrictions in our area, I remembered again this weekend that I have done one regular activity a lot less than normal in that time: driving. While this may be true for many Americans, this is particularly unusual in the suburbs. When a whole space where more than 50% of Americans live is organized around cars, driving significantly less makes for noticeable change.
Americans like suburbs, in part, because they are organized around cars and driving. Single-family homes often features garages and driveways. Private lots are often located beyond walking distance of key destinations including schools, grocery stores, parks, and jobs. Commuting by car is required in the absence of other transportation options and the suburb-to-suburb trip is common.
To start, making fewer car trips during COVID-19 means I have more time in life. I do not have a long commute but with an average commute time of just under twenty-seven minutes, less driving and/or working from home means many suburbanites have more time during the week. Those who have had to continue to drive to work regularly encounter less traffic on the road and can arrive more quickly. And I have driven less to other locations as well. (Of course, others might have driven more during COVID-19, particularly delivery drivers of all sorts.)
Second, I have had to do less maintenance on my car and pay for less gas. Cars are expensive to own and maintain. It is not only about the frequency of trips; we have put off longer trips to visit family or take vacations. Suburbanites may be used to driving trips to the city or vacation spots but tourist activity is down during COVID-19. The time between oil changes and regular maintenance has increased, likely lengthening the life of our vehicles. (At the same time, COVID-19 might make owning a car more necessary when public transportation is not as attractive.)
Finally, driving less means more suburbanites are spending more time at home. The private single-family home in suburbia may look more attractive during COVID-19 as it often offers space and distance from others. Particularly in wealthier suburbs, residents can work from home, have plenty of entertainment and leisure options, and have things delivered to them.
While COVID-19 has affected driving and time use in suburbs, it is less clear how attractive this is to suburbanites. Americans in general like to combine driving and homes but during COVID-19 they may have seen more of their homes and less of the road. Since driving is connected to many social and economic activities in suburbs, this is not just about accessing opportunities; it is about living out a particular style of life. Will suburban COVID-19 experiences help push residents and leaders toward a new kind of suburbs or will people be overjoyed to return to typical driving patterns?
Then, in October 2018, Sears declared bankruptcy, and they decided it was time. Here was the scheme: MP built a position against two slices—called “tranches” in Wall-Street speak—of mall debt with, they thought, a relatively low likelihood of being repaid: CMBX.6 BB and BBB-, which were filled with roughly $2 billion worth of debt, an outsized chunk of which was issued to 39 struggling shopping malls. They bought credit default swaps on the block of debt, which amount to insurance policies on the bonds. If the bonds went completely bust—similar to, say, your house burning down—they would be owed their entire value in cash. But even if the tranches decreased in value, MP’s insurance would be worth more and they could sell the swaps for a profit. In any case, it was an asymmetric bet: the downside risk was confined to what they’d have to pay to hold the insurance, but the potential payout was many multiples of that amount—theoretically in the billions…
Meanwhile, McKee was becoming known on Wall Street as “The Queen of Malls,” and other bearish hedge funds began asking her for advice on shorting CMBX.6. “All I did was talk about malls all day,” she said. This included portfolio managers working for the infamous billionaire activist investor Carl Icahn, who, by the end of 2019, had put on a $5 billion short position, arguably the largest by anyone on Wall Street. This went against conventional wisdom at the time, considering that the value of the mall debt was going up, but once word got out that Icahn had entered the ring, the trade was taken more seriously on Wall Street. “That made a lot of people stand up and say, ‘Hold on, we should look at this,’” McNamara said…
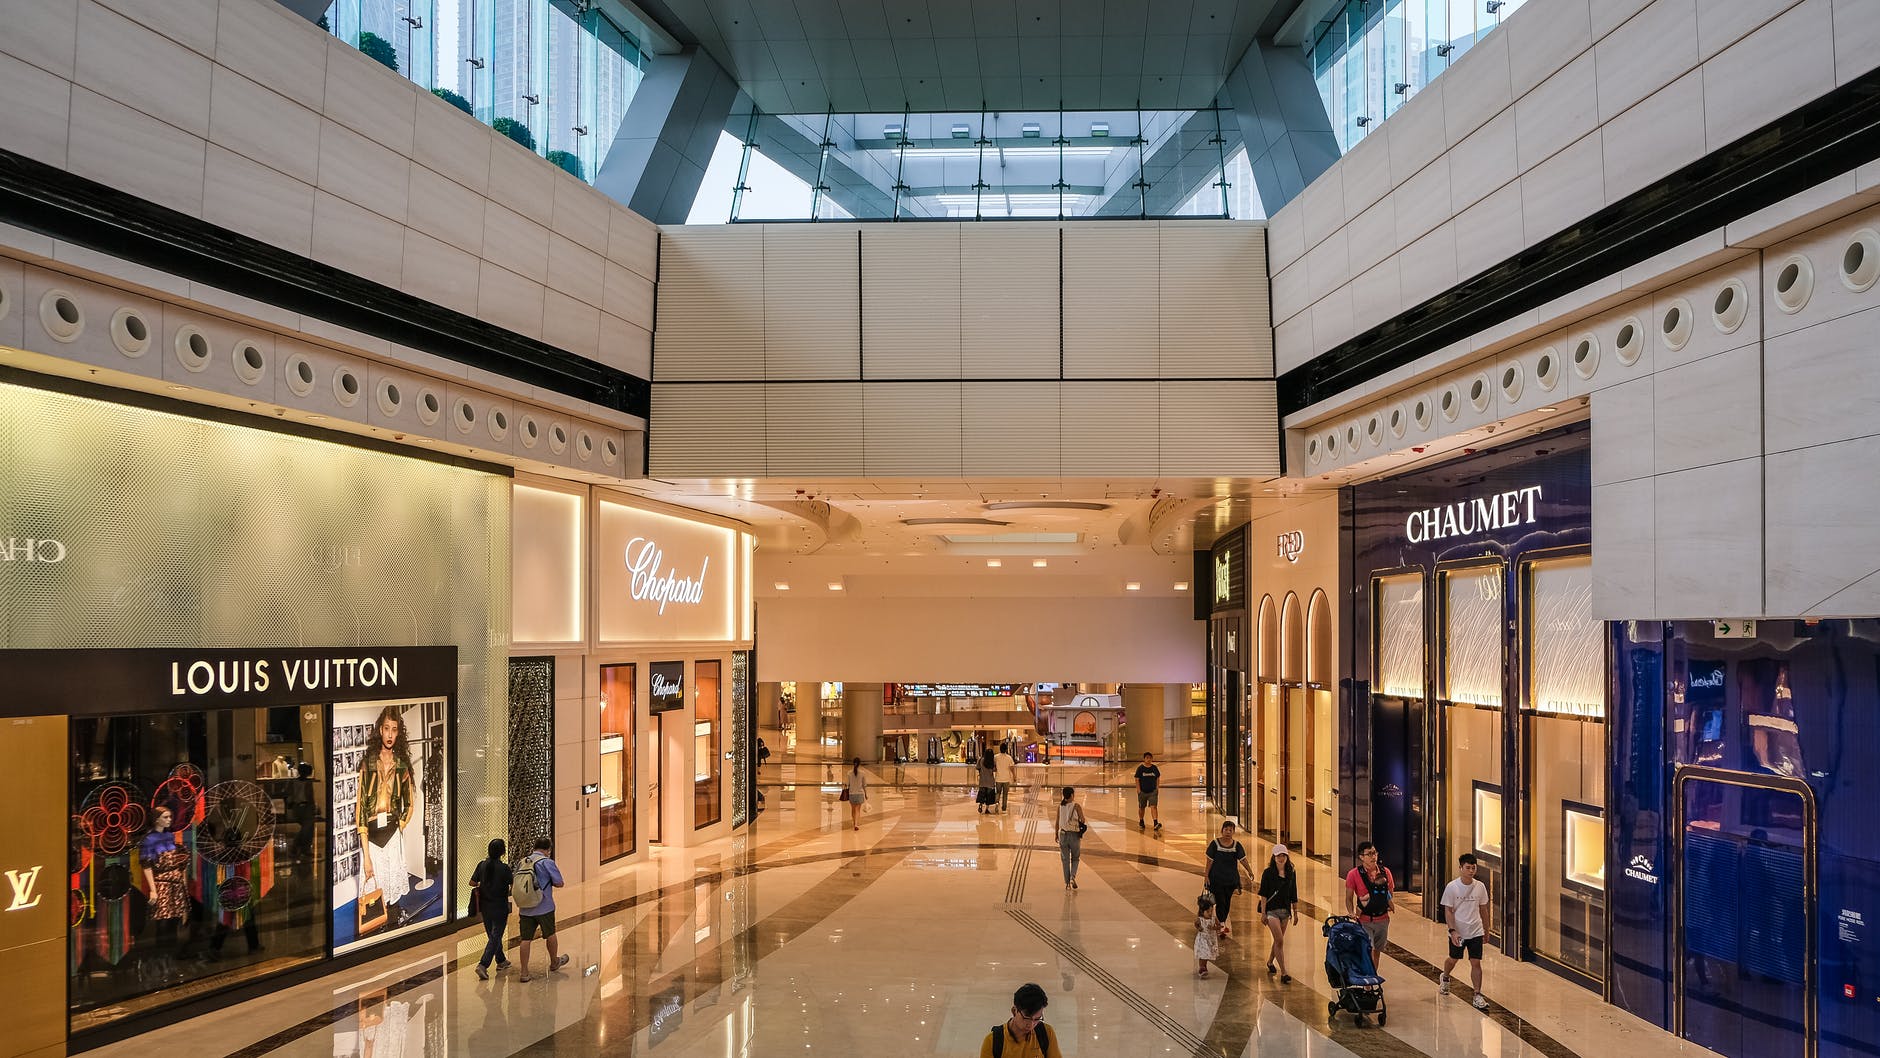
Between March and July, as businesses struggled to pay their rent, CMBS delinquencies, according to Trepp, increased by a staggering 492 percent, the value of the hotly contested CMBX.6 tranches were slashed in half, and the brick-and-mortar retail sector was on the verge of going belly-up. Large retailers like Gap stopped paying rent; Neiman Marcus, J.Crew, Brooks Brothers, Ann Taylor, Loft, Pier 1 Imports, GNC, and JCPenney (among many others) filed for bankruptcy; Victoria’s Secret was closing hundreds of stores and Lord & Taylor announced it was closing its doors for good and liquidating inventory; TJX and Macy’s recorded losses of $5 billion and $2.5 billion, respectively; foot traffic for shopping malls plummeted to basically zero; and, in April, clothing sales fell 79 percent, the largest drop on record. “The economy has declared war on your aunt’s wardrobe,” Scott Galloway, marketing professor at New York University, mused on his podcast Pivot. As for Crystal Mall, Simon Property Group, its landlord, defaulted on the mortgage and is planning on handing over the keys to their special servicer…
COVID-19 also revealed a dirty secret hidden in the crawlspace upon which many commercial mortgage-backed securities were built. A University of Texas at Austin study published in August claimed that banks knowingly inflated underwriting income for $650 billion worth of commercial real estate mortgages issued between 2013 and 2019, including by 5 percent or more for nearly a third of the roughly 40,000 loans. “A well-documented historical pattern is that fraud thrives in boom periods and is revealed in busts,” the university researchers wrote, adding that end investors were unaware of this hidden risk, a deception akin to buying a Ferrari secretly outfitted with a rusted-out Kia engine. It could be argued that CMBS had been a magic trick all along, with big banks one step ahead, luring investors to pick a card from a rigged deck. It took a global pandemic—an act of God—to reveal this financial sleight of hand.
Americans and financial institutions were bullish about single-family homes into the 2000s, until they were not and the housing market imploded. Americans liked shopping malls…and is this a repeat?
Since the story suggests those shorting shopping malls are in the minority, does this mean other investors truly believe shopping malls will successfully reinvent themselves and or redevelop enough to successfully pay their mortgages? Or, are a lot of people hoping that shopping malls make it through?
The default of shopping malls could have a broad effect, particularly on communities that will struggle to fill that space and recapture some of the tax revenue that shopping malls could bring in. More broadly, the difficulties retailers face could impact a lot of people in multiple ways.
“There’s a lot of talk about a universal voucher program in housing and entitlements, which would be a game changer for family homelessness, but you still have the problem of there not being enough places for people to rent,” Popkin said. “So we need to push both on the supply side and on the increased assistance side.
”Funding could go toward replacing tens of thousands of public housing residences lost between the ’80s and now, whether it be with new construction or renovating older buildings, she said.
“I’d like to see them built in a thoughtful way that doesn’t repeat the mistakes of the past,” she said.
The demolition of public housing high-rises in Chicago and numerous other big American cities had multiple effects. One of the stated goals was to help deconcentrate poverty. By moving public housing residents into other neighborhoods, it was hoped this would help their life chances.
But, this has not worked as well as might have been hoped. If the goal was simply to remove an eyesore in the city and push problems with housing and poverty out of the public eye, mission accomplished. The stigma of such projects disappeared with their demolition. Some of the land, when it was in desirable locations, was redeveloped. If the goal was to help people find good housing and attain more opportunities, this would involve a more robust approach to building and making available good housing. In Chicago, there were promises to provide for better lives andbuild more units…and it did not happen.
Just because the public housing high-rises are not visible in many locations does mean there is not need for cheaper yet quality housing. Americans do not have much stomach for public housing but the need is there to be addressed.
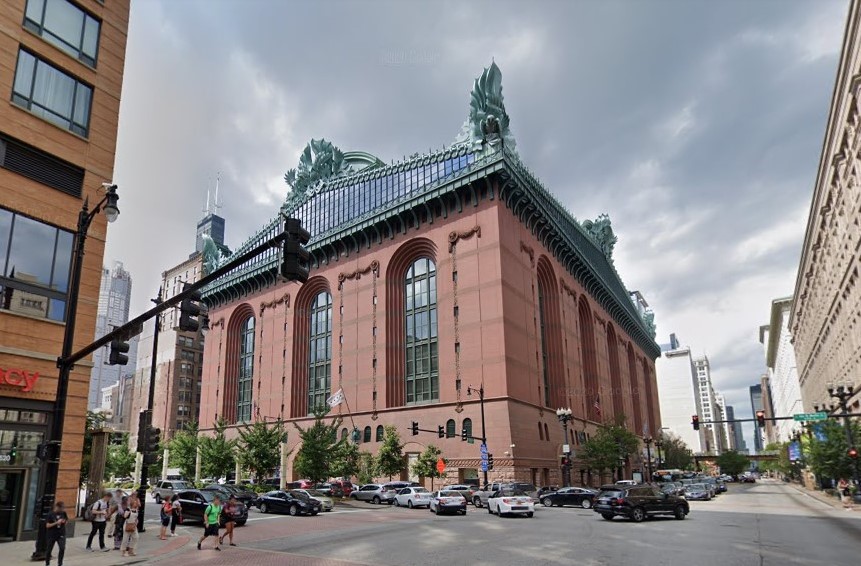
Harold Washington Library Center, Chicago – Google Street View
Libraries, especially during times of crisis, have long been far more than just places where people can check out books and DVDs. With their high-speed internet connections, meeting rooms and massive depositories of information, print and otherwise, they are a beacon to those needing assistance or companionship.
That has changed during the pandemic. Libraries across the state closed for months after Gov. J.B. Pritzker issued his stay-at-home order in March, and though many reopened during the summer, some services remain diminished or unavailable for fear of transmitting the virus.
But libraries have made creative adjustments in these strange times, boosting their Wi-Fi signals so patrons can use the internet in their cars, expanding their curbside pickup services and offering all manner of virtual programming…
The libraries that are staying open typically have large buildings and relatively few patrons coming inside, leaving plenty of social distance. But as winter approaches, they must decide whether they can accommodate those who depend on the buildings as warming centers.
During COVID-19, spaces cannot accommodate the same amount of people or any people at all. They cannot be public spaces in the typical sense of the phrase: the public cannot congregate there.
And after COVID-19, will libraries and other public spaces be the same? Will they garner more public support or less? Even as some will want just to return to a typical library trip, the public library present in many communities and neighborhoods can continue to provide for the good of many people.
The DuPage County Board has approved a doubling of the 4-cents-per-gallon gas tax in response to revenue losses amid the coronavirus pandemic.
The new rate goes into effect July 1. The existing rate has been in place since 1989.
According to county transportation officials, gas tax proceeds have fallen nearly 25% since April as more people have been staying home and working remotely. The gas tax increase is expected to raise $16 million more a year for an aging system of roads and bridges.
A multimillion-dollar streetscape project in the heart of downtown Naperville is being postponed to mitigate the burden on businesses already struggling under COVID-19 restrictions.
Initially slated for completion last spring, the $3.2 million in proposed improvements — plus an additional $2.2 million in related utility work — were delayed a year due to the challenges and uncertainties of the pandemic, officials said.
These illustrate two different strategies for tackling a budget shortfall. The first tries to raise more revenue. The gas tax is a relatively small increase for each purchase but it adds up since so many suburban lives are dependent on driving. That this tax from the county has not increased for over thirty years is likely to be a small comfort for many as other costs have increased as well. But, raising a number of taxes and fees without huge jumps in any one of them can help local governments close the budget gap.
The second example pushes off planned costs to the next year. Each year, local governments consider improvements and capital projects that will improve the infrastructure of their community. Even in a good year, a number of projects may be dependent on funding from outside sources such as state governments or the federal government. This year, when money is scarce all around, some projects will be pushed into the future. This may not be a big problem for now – unless a lot of projects get pushed back, future budgets cannot handle everything, and infrastructure slowly falls apart. If this year’s budget is bad and next year’s is also affected, when will these local projects get done?
More communities will be making similar decisions in the weeks ahead. How much each community is affected may differ as might their strategies for addressing the budget issues.
If people gather for Thanksgiving, experts are advising they meet and eat outside. Here is one example:
How much safer is an outdoor meal than an indoor meal?
Much, much safer. Almost all transmission of this virus happens indoors.
Even if people are close together?
Eating outdoors doesn’t mean you’re invincible. Still try to stay six feet apart. If you huddle together around a cramped table and have close, face-to-face conversations with the people next to you, you could absolutely infect them.
This is time for the patio or lawn, found in millions of single-family homes and in many suburbs, to shine. The lawn does not just have to be a status symbol; it can confer health benefits by allowing people to spread out.
This is not the first time that the suburban lawn was said to boost health. In the gathering urbanization of the nineteenth century, suburban lawns provided space away from polluted and noisy cities. Listening to the radio the other day, I again heard mentioned how River Forest, Illinois was intentionally built with features meant to highlight nature.
Before COVID-19, the suburban lawn was also said to aid good health. It helps people get outside to work and move around (canceled out by the use of gas-powered equipment?). It encourages kids to play in a safe space. Depending on the season and/or weather, the patio and yard can act as an outdoor extension of private living space.
Now, the lawn and patio can be a private spot away from COVID-19. Outsiders are not welcome. The fresh air, breeze, and distance can limit transmission. Nature, or “nature” in many suburban settings, can serve as an oasis. All that lawn and patio maintenance can be put to use. And, hopefully, people can stay COVID free.