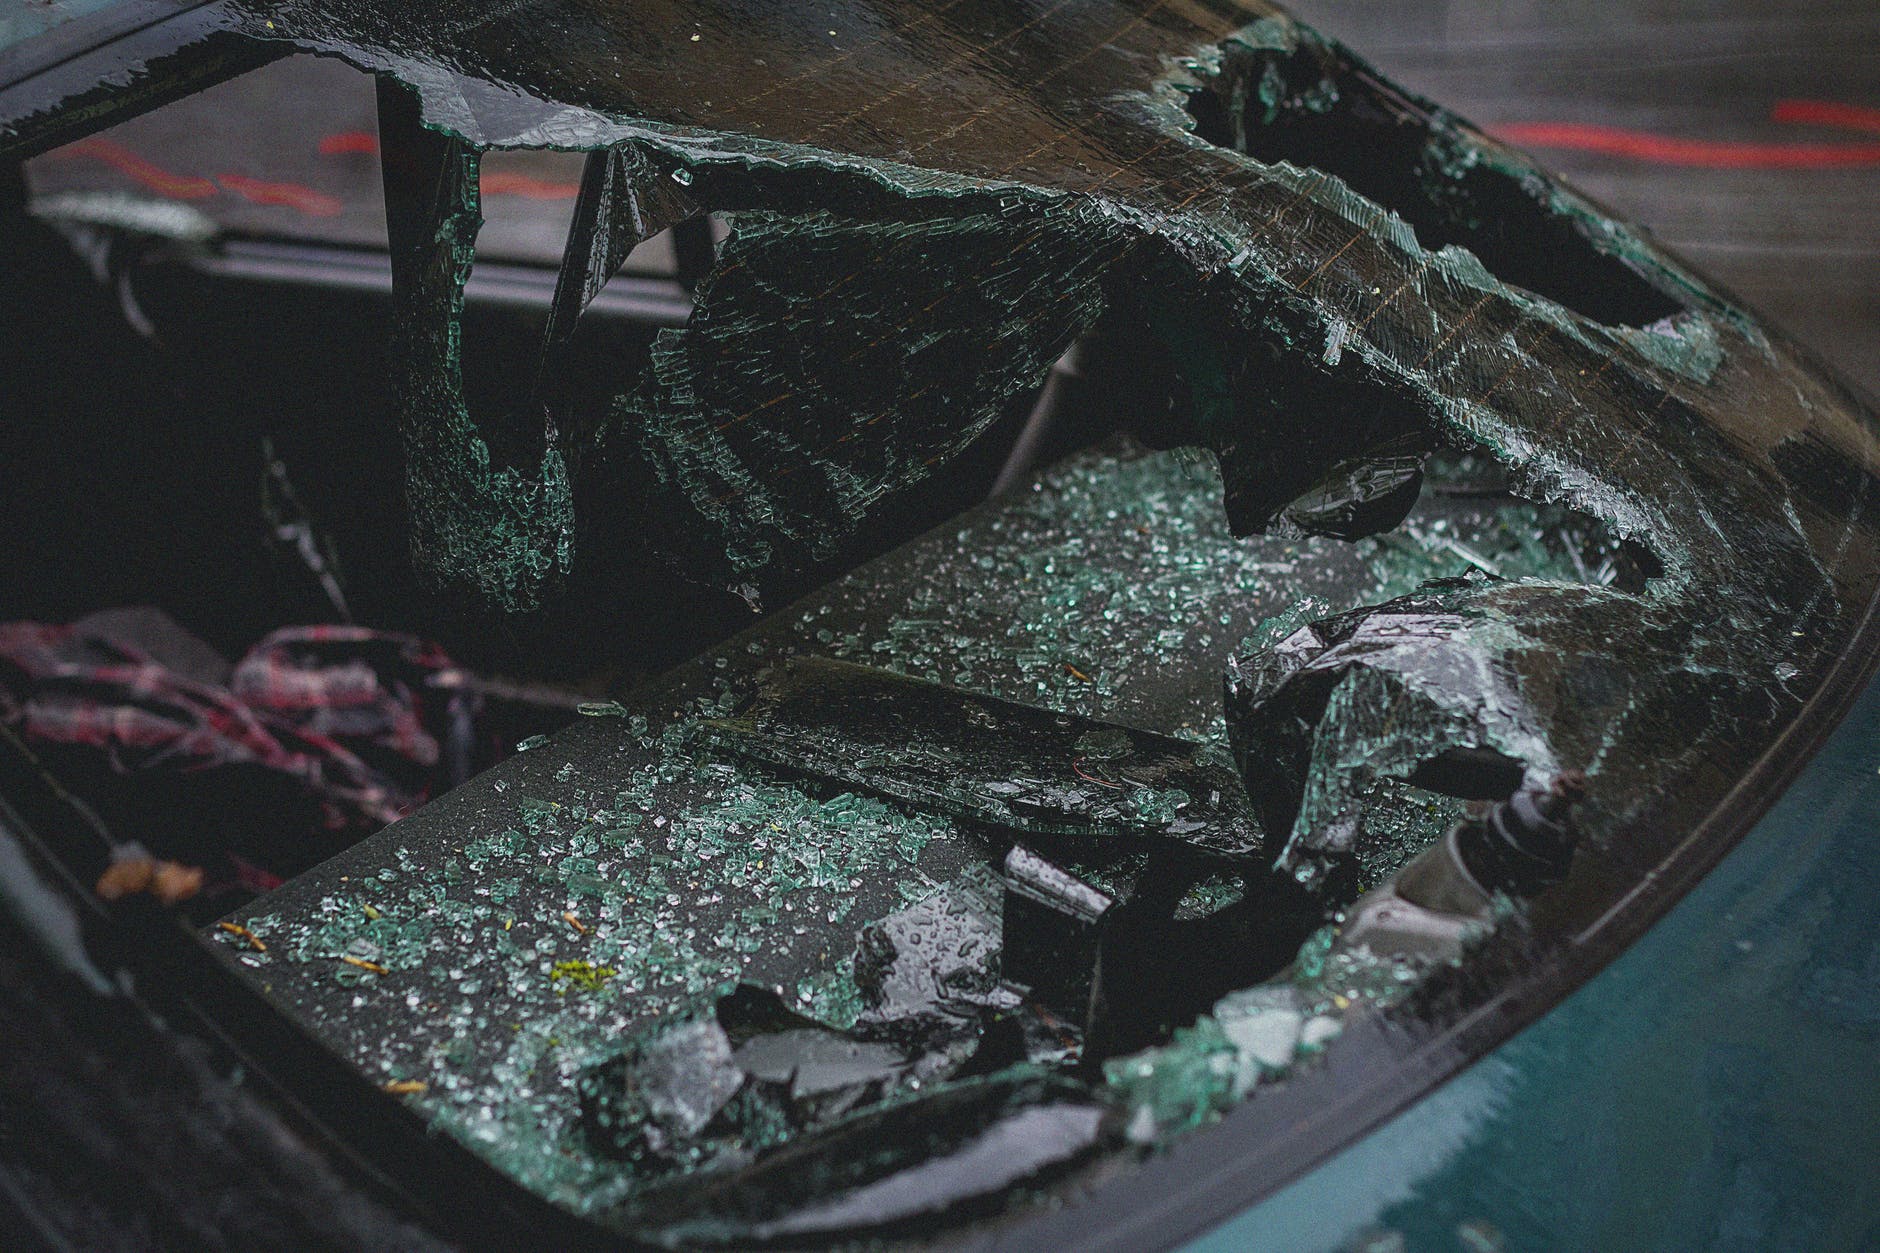
A group of researchers affiliated with Harvard Medical School recently issued a working paper reporting an association between the release days of the most-streamed albums and an increase in US traffic fatalities. The authors say the pattern is consistent with smartphone-enabled driver distraction, including the use of in-vehicle phone-mirroring platforms.
“Modern smartphones present new threats to road safety beyond talking and texting, but the real-world effects are difficult to study,” the researchers said in their explanation for performing the study. Fatal traffic accidents and release days for popular streaming albums, the team said, were chosen as an “exogenous event” that “may offer an opportunity to quasi-experimentally study the impact of distraction using observational data.”…
The team used data from the US Fatality Analysis Reporting System, which catalogs all fatal crashes on public US roadways, and compared that to data from Spotify charts, looking specifically at the top 10 albums with the most first-day streams between 2017 and 2022 (Taylor Swift and Drake each appear three times in the top 10, for those curious)…
They adjusted for fixed effects like holidays, the day of the week and week of the year, repeated the analyses to select for infotainment systems and other automobile information, and accounted for driver characteristics including age, the number of people in the car, and involvement of alcohol. The team even conducted multiple “placebo album” falsification tests, running experiments on randomly-selected dates, to be sure they weren’t overlooking something else unknown.
This sounds like an example of a “natural experiment” where researchers can see what happens to driving deaths on Fridays with major music releases and Fridays without them.
Three quick thoughts in response:
- I remember when major music releases were on Tuesdays, not Fridays. And when the music was not yet digital, a consumer had to go to a location to buy a physical copy. I was never in any release lines but I definitely went to stores on release day to buy CDs. (Have never done this for records or cassettes.)
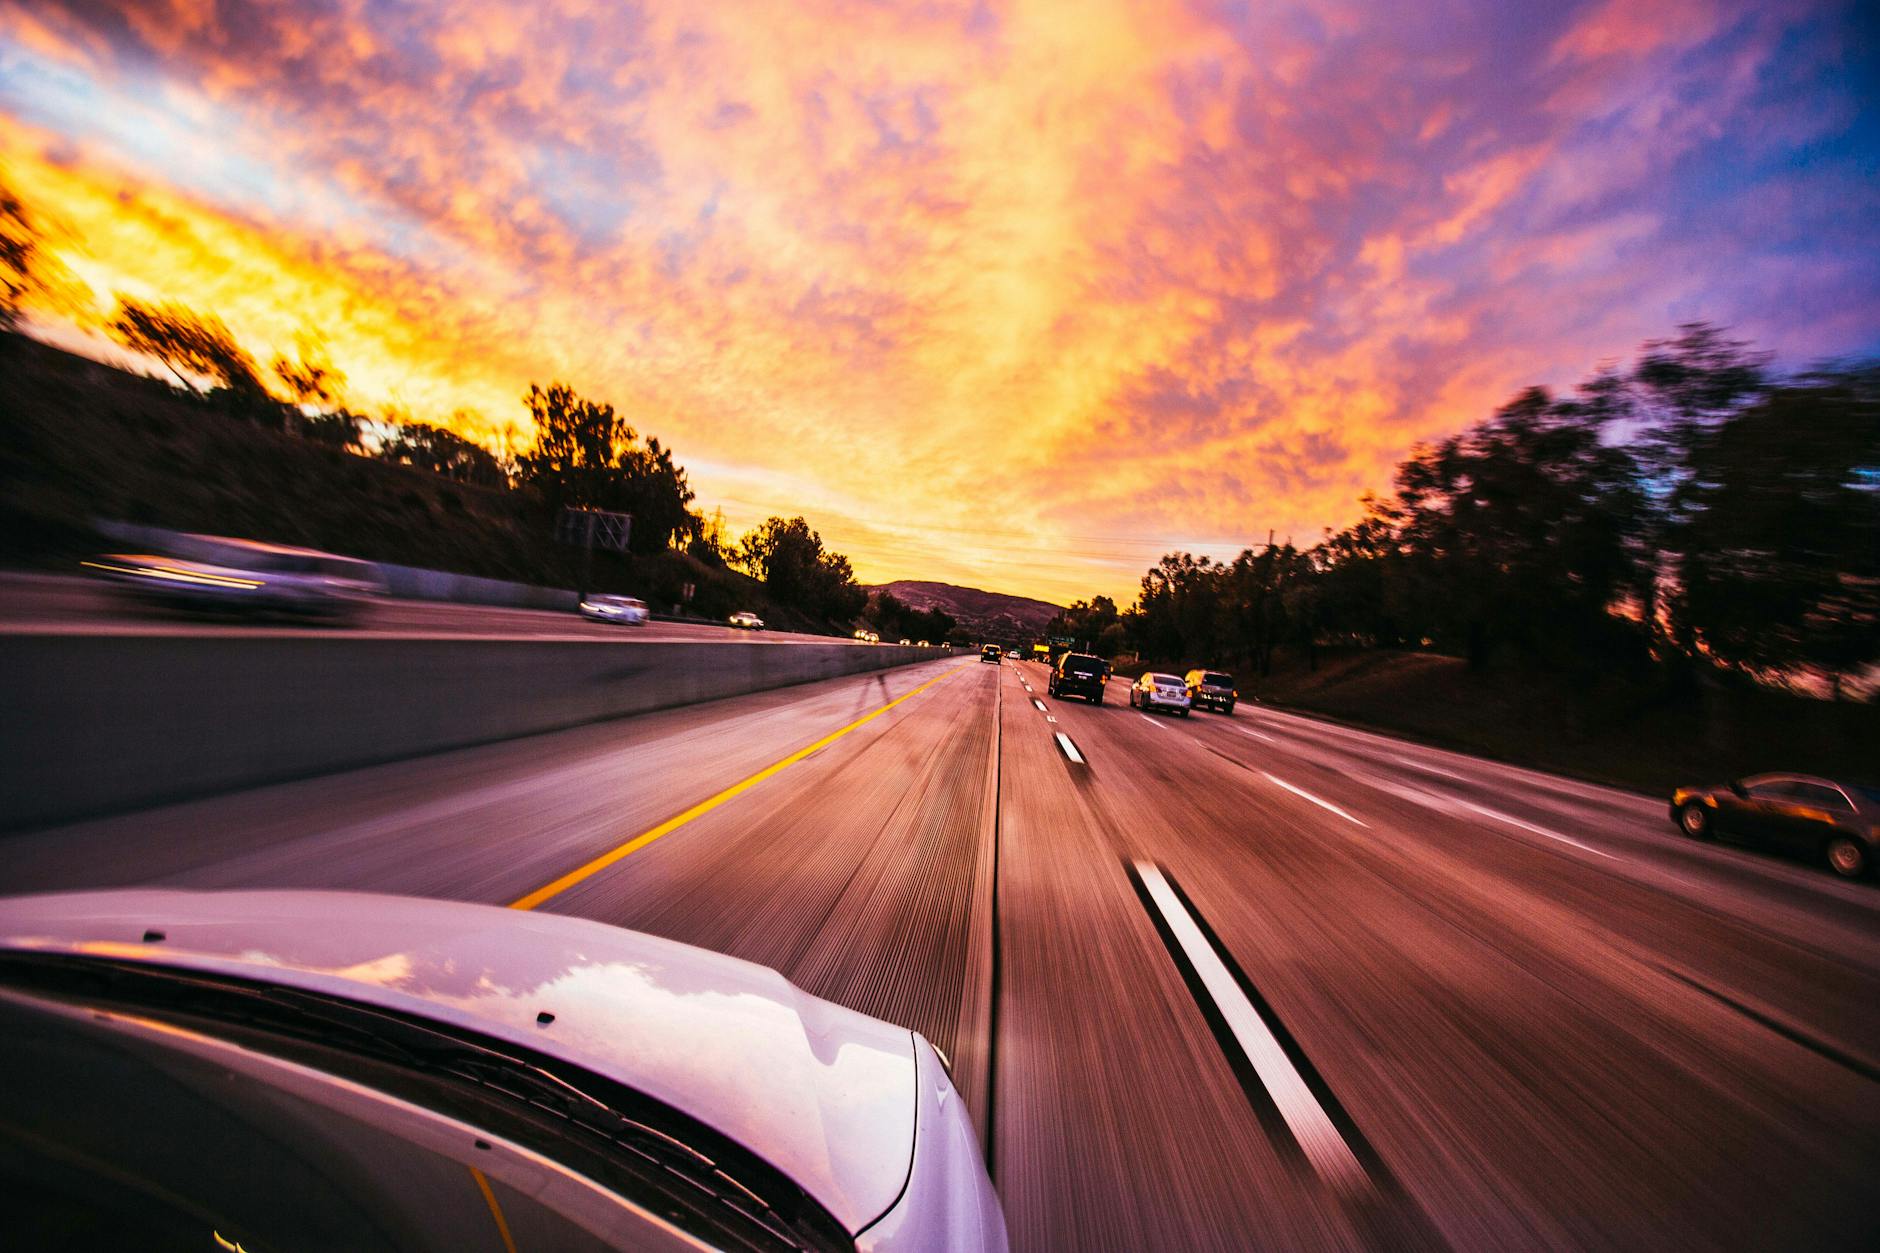
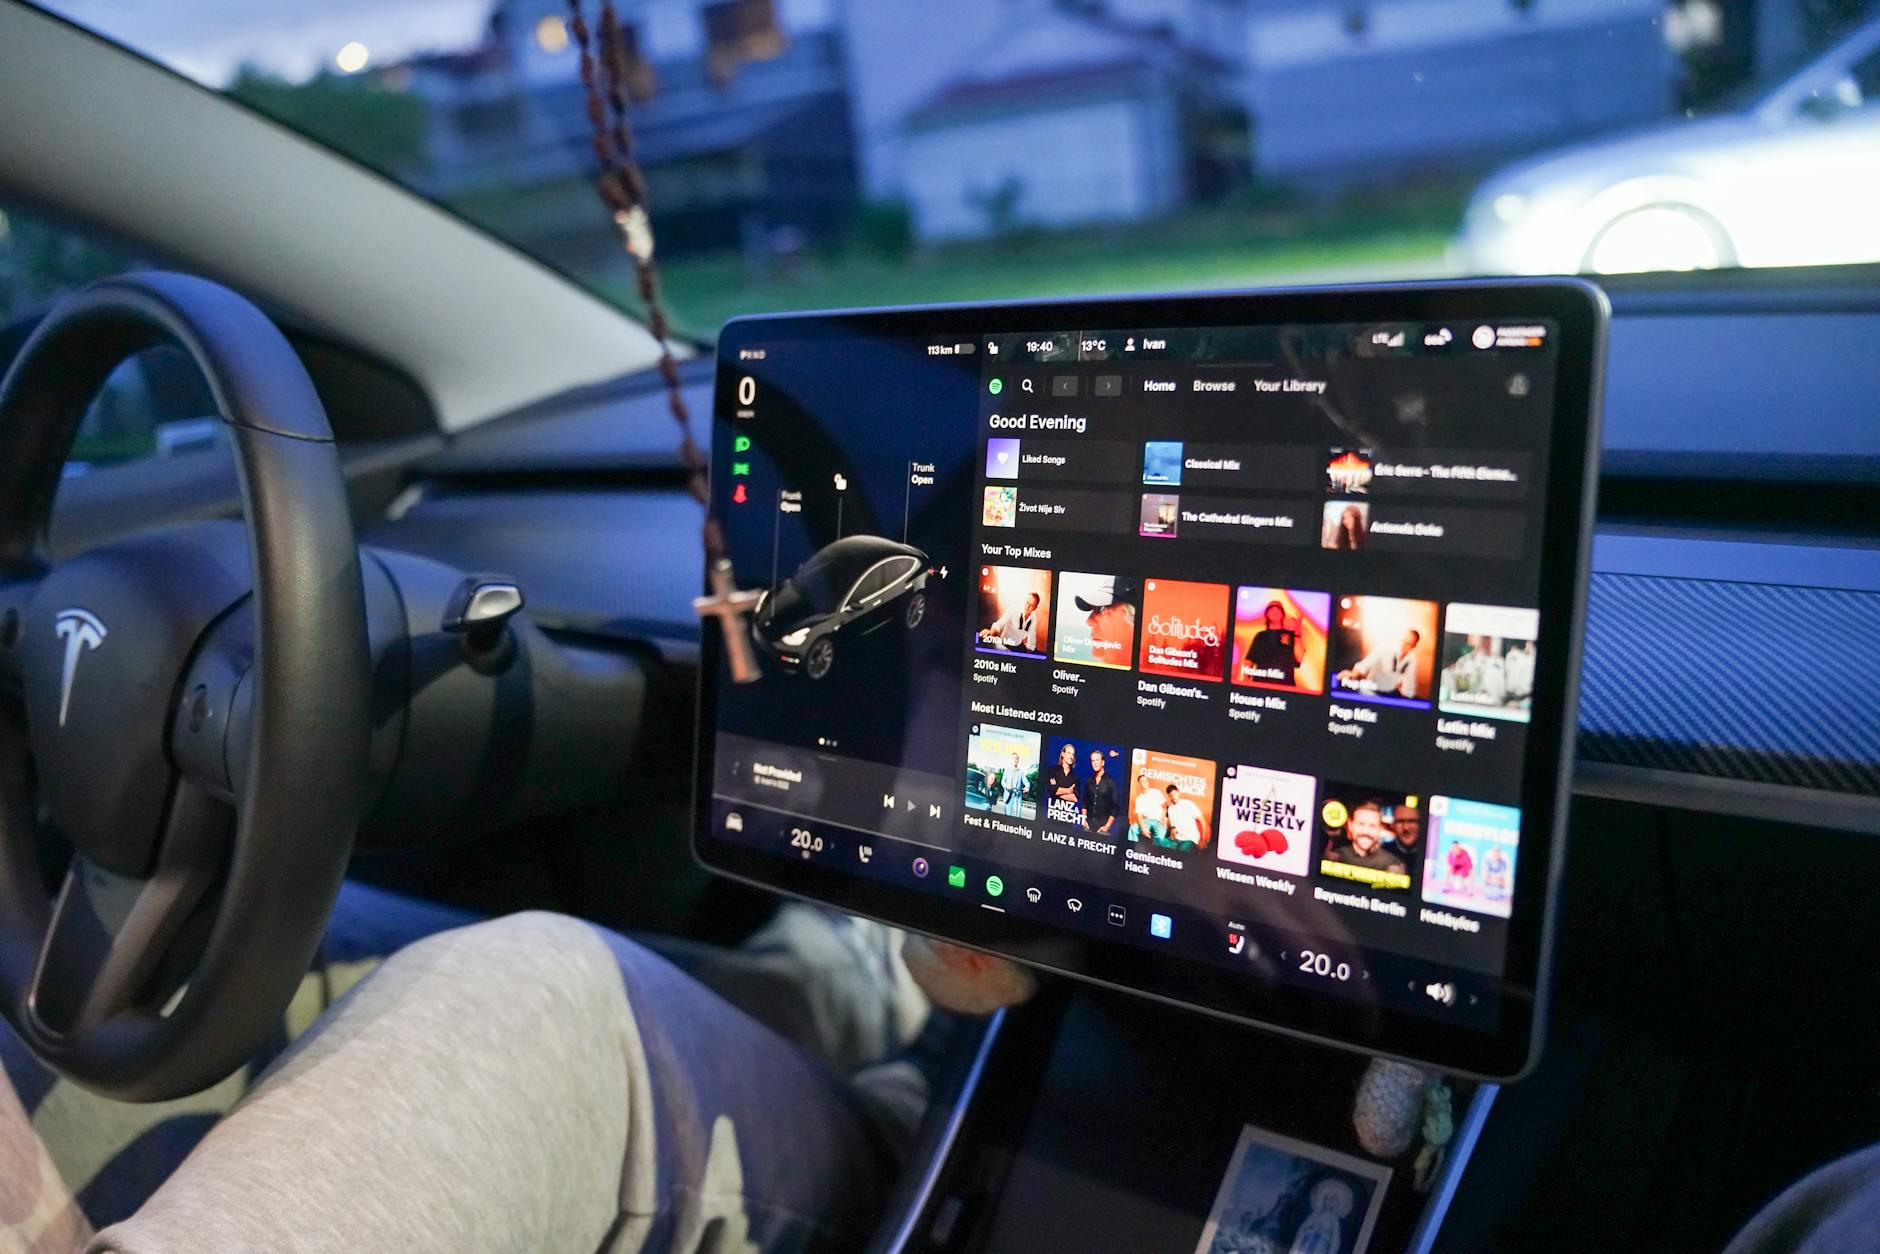
- How many people enjoy new music in a car versus via ear buds, headphones, and speakers in other settings? A moving vehicle can make it difficult to hear music. The road is noisy. A vehicle makes noise. The car has a certain sound system. In newer vehicles, the listener is streaming music. But driving is better with entertainment. And driving with friends and music can be fun. Driving fast with friends and loud music can feel fun.
- What might be a public health response to this? Regulations about screens in cars – making them easier to operate, smaller, less distracting, etc.? Music release days back on Tuesdays or another weekday to avoid the possible connections to weekends? Public safety messages? Promoting the use of driverless vehicles?