Sellers are slashing prices at record rates to to lure hesitant buyers put off by soaring mortgage rates and economic uncertainty.
In July alone, 27.4 percent of listings had a price cut — the highest rate ever recorded in Zillow’s monthly data going back to 2018.
It helped push prices down year-over-year in 25 of the 50 largest US cities. Most were in the South and West…
Tampa prices are down 6.2 percent, Austin 6 percent, Miami 4.6 percent, Orlando 4.3 percent and Dallas 3.9 percent, according to Zillow…
Price cuts are more common in the South and the Mountain region, according to Zillow, as homeowners desperately try to offload properties.
Summary of this data: these are “record” cuts, supported by the number of listings with a price cut (27.4%), the number of metro areas with price cuts (half of the largest cities), and four specific cities have had prices drop between 3.9% and 6.2%.
This may be unusual behavior compared to prior years. It might not be what property owners want to see. Is it a “housing panic”?
Here are several indicators I could imagine of a larger panic regarding housing values:
Prices dropping across all or most metro areas. (We read later in the article that values are up in some metros, mostly in the Northeast and Midwest.)
Price drops of more than 10%. This may be an arbitrary cut-off but it is at least double-digits.
Consistent public reporting and/or conversation about a housing panic. If there was truly a panic, wouldn’t it be easy to find that conversation?
An inability to sell many homes even with larger price cuts.
This is worth paying attention to, both for the actual figures and how they are interpreted.
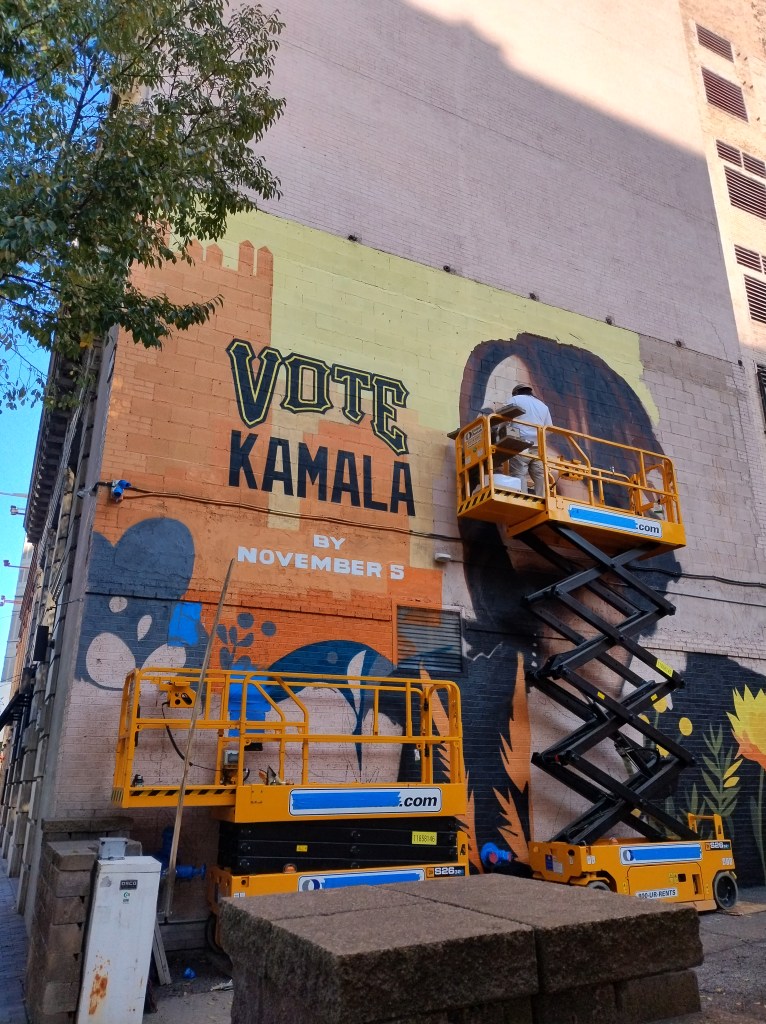
Pittsburgh viewers tuning into Monday Night Football this week watched their Steelers beat the New York Giants — and 26 political ads.
That’s just a small slice of the roughly 2,300 political ads the typical Pittsburgh household has seen on television this year, according to AdImpact, more than any other market in the country.
The nonstop political onslaught for viewers, however, means a windfall for the stations. The local ABC affiliate broadcasting Monday’s game charged as much $150,000 for a single 30-second ad, an astronomical sum for the market.
Pittsburgh is the most extreme example of a phenomenon happening in swing states across the country: Campaigns and their allies are buying so many political ads that local businesses — the personal injury lawyers, car dealers and furniture stores that are usually staples of local news commercial breaks — often can’t reserve any airtime even if they could afford the inflated rates.
While political ads are likely airing almost everywhere due to local and state races, the presidential race depends on a few select states and big markets within them. Which party can turn out the most voters in the key suburban districts?
It would be interesting to see data after the election about how Pittsburgh area residents responded to these ads. How many people did they convince? What did it cost roughly to pickup each vote? How did these big ad buys perform compared to social media campaigns that can target specific individuals? Money was spent…but how effective was it.
Similarly, how might these ad seasons boost local media organizations? Is this like Christmas season for media where the money that comes in during political ad season covers budgets for a much longer time? If political ad season was reduced in length or in spending, how might these media organizations do with less money?
Lots of things happen in big cities. Some stories are stranger or more influential than others. But how might one story get commemorated for years? Which cultural narratives last? One non-profit leader described this particular story:
“The incident is woven into the city’s pop culture fabric, and the anniversary seemed like an opportunity to emphasize that the world has to protect our natural resources, but it didn’t work out,” Frisbie said of the effort.
The article on the 20th anniversary provides some hints on how this story caught on and continues to be told. To go beyond a story that the people involved tell over and over, some help is needed:
-Famous people involved. The music group was well-known with multiple #1 platinum albums under their belt. This was not a random tour bus.
-Criminal charges and a court case. This involves different public bodies and can keep a story in the news.
-The media. A strange but true story – bathroom matters! a famous band! charges! – is a good one to get attention. And can we expect stories on the 25th anniversary, the 30th, and so on?
I am sure it would be hard to measure but it would be interesting to look at how this story stacks up against other stories in the city of Chicago. Which ones stand the test of time? Does this one make it into “official” lore (books, museums, memorials, etc.)? What is the half-life of pop culture stories in Chicago?
The red brick Georgian Revival mansion in Winnetka made famous by the 1990 film “Home Alone” garnered much attention when it was listed on May 24 for $5.25 million — more than three times what it had sold for in 2012 to its current owners — and in a testament both to the condition of the home and the popularity of Winnetka, the mansion found a buyer just one week later.
How many houses generate this much interest when they are on the market or even when they are not? The same story above noted the number of visitors to the fictional home of the McCallisters:
A 1992 Chicago Tribune headline for a story about the home being placed on a local house walk called the mansion “a “home that’s never left alone.” Then-owner Cynthia Abendshien told the Tribune even back then that “there are a lot of people, especially children, that will knock on the door and ask to see the house.”
It’s not much different today, although the mansion now is set behind a wrought iron fence and gate. On a nice day, a visitor showing up to gawk at the mansion soon will discover that there’s company — other visitors there for the same purpose.
There are historic mansions that get a lot of visitors. Think Hearst Castle, Biltmore. Lots of communities have preserved older homes or historic preservation districts. Homes designed by well-known architects, like Frank Lloyd Wright, draw the attention of visitors.
But homes made famous by a movie? Particularly a movie aimed at kids? That when it goes on sale prompts articles by the New York Times, Architectural Digest, and the Today Show? It may be an particular confluence of when the movie was made, the way news outlets today report similar stories, and the interest people have in famous or celebrity houses. I am sure the home will be back in the news at some point, though the movie is now over 30 years old and real estate markets change.
This is a familiar situation in American communities: a landowner proposes a change to their land. The potential change goes to the local government for approval. Neighbors and community members have an opportunity to weigh in. Some people voice opposition. How might we know whether the community opposition is “strong” or not? It could be measured in multiple ways:
-The number of people clearly opposed to the change. This could be the difference between two opponents speaking at public meetings versus 60. Or there may be an online petition with hundreds or thousands of signatures against the proposal.
-The loudness of the opposition. Are those opposed speaking out regularly? Are their concerns expressed clearly and often online and in the media? Is the opposition clearly identifiable and known within the community? What kind of rhetoric is being used by all sides?
-The connections and resources of the opposition. Do they have the ear of leaders and politicians? Who can support the opposition? Will an unfavorable decision lead to a lawsuit?
-Is “strong” opposition that which leads to the proposal being voted or turned down?
All of this is context dependent as well. Certain proposals will generate more attention based on their location and the proposed change.
I would guess most opponents of proposed developments are spirited and believe in their cause. Whether this adds up to “strong” opposition might be much harder to judge.
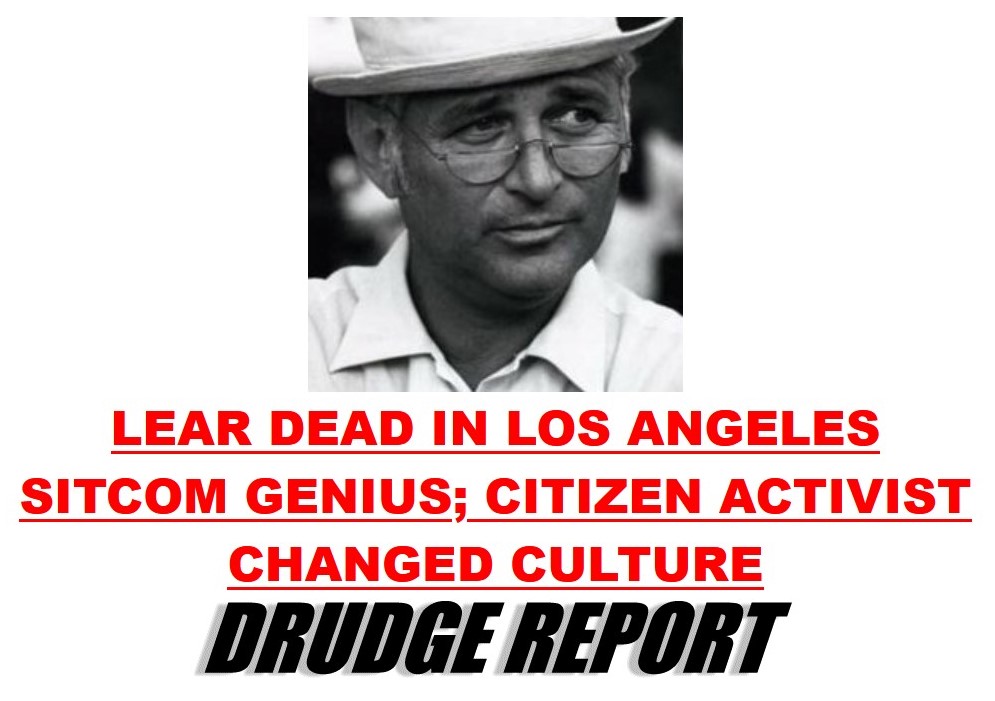
Lear had already established himself as a top comedy writer and captured a 1968 Oscar nomination for his screenplay for “Divorce American Style” when he concocted the idea for a new sitcom, based on a popular British show, about a conservative, outspokenly bigoted working-class man and his fractious Queens family. “All in the Family” became an immediate hit, seemingly with viewers of all political persuasions.
Lear’s shows were the first to address the serious political, cultural and social flashpoints of the day – racism, abortion, homosexuality, the Vietnam war — by working pointed new wrinkles into the standard domestic comedy formula. No subject was taboo: Two 1977 episodes of “All in the Family” revolved around the attempted rape of lead character Archie Bunker’s wife Edith.
Their fresh outrageousness turned them into huge ratings successes: For a time, “Family” and “Sanford,” based around a Los Angeles Black family, ranked No. 1 and No. 2 in the country. “All in the Family” itself accounted for no less than six spin-offs. “Family” was also honored with four Emmys in 1971-73 and a 1977 Peabody Award for Lear, “for giving us comedy with a social conscience.” (He received a second Peabody in 2016 for his career achievements.)
Some of Lear’s other creations played with TV conventions. “One Day at a Time” (1975-84) featured a single mother of two young girls as its protagonist, a new concept for a sitcom. Similarly, “Diff’rent Strokes” (1978-86) followed the growing pains of two Black kids adopted by a wealthy white businessman.
Other series developed by Lear were meta before the term ever existed. “Mary Hartman, Mary Hartman” (1976-77) spoofed the contorted drama of daytime soaps; while the show couldn’t land a network slot, it became a beloved off-the-wall entry in syndication. “Hartman” had its own oddball spinoff, “Fernwood 2 Night,” a parody talk show set in a small Ohio town; the show was later retooled as “America 2-Night,” with its setting relocated to Los Angeles…
One of Hollywood’s most outspoken liberals and progressive philanthropists, Lear founded the advocacy group People for the American Way in 1981 to counteract the activities of the conservative Moral Majority.
The emphasis here is on both television and politics. Lear created different kinds of shows that proved popular as they promoted particular ideas. He also was politically active for progressive causes.
How might we know that these TV shows created cultural change? Just a few ways this could be established:
-How influential were these shows to later shows and cultural products? How did television shows look before and after Lear’s work?
-Ratings: how many people watched?
-Critical acclaim: what did critics think? What did his peers within the industry think? How do these shows stand up over time?
But, the question I might want to ask is whether we know how the people who watched these shows – millions of Americans – were or were not changed by these minutes and hours spent in front of the television. Americans take in a lot of television and media over their lifetime. This certainly has an influence in the aggregate. Do we have data and/or evidence that can link these shows to changed attitudes and actions? My sense is that is easier to see broad changes over time but harder to show more directly that specific media products led to particular outcomes at the individual (and sometimes also at the social) level.
These are research methodology questions that could involve lots of cultural products. The headline above might be supportable but it could require putting together multiple pieces of evidence and not having all the data we could have.
That, perhaps, is the point that all those critics who dismissed the Kings League have missed. It may well be a circus. But Piqué might respond that there is nothing wrong with being a circus. Circuses are popular. They draw a crowd, they hold the gaze, because nobody is ever quite sure what is coming next.
While the circus itself has passed peak popularity in the United States, the argument above appears to have some merit: the average resident of society today is presented with a vast array of circuses. Some are free, some are not. They come through various media forms. They all promise to try to entertain or engross you. Novelty and spectacle are key. The speed at which it all happens is new as is the number of options.
What does this do to the potential viewers? Does it enhance their lives in the long run? Do people want their lives dominated by circuses or would they rather invest in longer-term pursuits, relationships, and community life?
The example above presents a modified form of soccer/football with its own twists. Fans of the regular game plus others interested in a fast-moving and entertaining time can tune in or attend. How long does this last?
Media stories and/or reports can be counted in multiple ways. Count articles, headlines, the number of words written, social media posts, time spent on it during television broadcasts. Look at where and when stories are reported or not; does it lead the news or come later? Is it buried on a webpage or a newspaper page? How many resources are devoted to the topic could involve looking at how many reporters are on a story or the length of stories and reports.
But, this measurement question is complicated by the issue of knowing when the coverage is enough or not. My sense of most of the Internet arguments about this is that one political side feels for one reason or another that a story is not getting sufficient attention. Would an accurate count or measurement of coverage be convincing? What is an appropriate level of coverage depends on who is asking.
Additionally, the media has its own logics and pressures regarding what stories it covers and how it displays them. Not everything can be the top headline. Resources for covering the news are limited.
This might just be a perfect kind of argument for our politicized and fragmented current age. For those who really care about an issue, no level of media coverage might be enough. For those who are less interested or less aware, they might not care or know what they are missing. Media sources will provide information but not so do necessarily evenly across all news stories. And social media, the Internet, and politics provides space to express concern or outrage about the coverage or lack thereof.
Home prices fell for the first time in 3 years last month – and it was the biggest decline since 2011
This quickly relays information about recent trends – prices went down for the first time in a while – as well as longer patterns – biggest drop in over a decade.
Next are some figures on housing affordability:
Now, housing affordability is at its lowest level in 30 years. It requires 32.7% of the median household income to purchase the average home using a 20% down payment on a 30-year mortgage, according to Black Knight. That is about 13 percentage points more than it did entering the pandemic and significantly more than both the years before and after the Great Recession. The 25-year average is 23.5%.
The housing affordability statistic is put into terms accessible to a broad audience: nearly 33% of the median household income is needed to buy the average house with common mortgage terms. Additionally, this percentage is higher than recent years and a longer 25 year stretch.
Some housing markets are seeing bigger price declines than others:
Some local markets are seeing even steeper declines over the last few months. San Jose, California, saw the largest, with home prices now down 10% in recent months, followed by Seattle (-7.7%), San Francisco (-7.4%), San Diego (-5.6%), Los Angeles (-4.3%) and Denver (-4.2%).
It could be noted that these are expensive and hot real estate markets. Yes, they had larger drops but they had been pushed higher in recent years than many other markets.
And the article ends with information on mortgage rates:
The average rate on the popular 30-year fixed mortgage began this year right around 3%, according to Mortgage News Daily. It climbed slowly month to month, pulling back slightly in May but then shot more dramatically to just over 6% in June. It is now hovering around 5.75%.
This highlights the rise in mortgage rates this year. Some broader context might be helpful; what was the average rate before COVID-19 or over the last 10 years?
This article provides numerous statistics and often puts the figures in context. Yet, it does lead one lingering question: what is the state of housing prices overall? One answer might be change after a period of trends during COVID-19. Another might be to focus on different actors involved: how does this affect the housing industry or what about the difficulty of some to get into the housing market or it could be a story about higher housing values for many homeowners.
Statistics are not just facts thrown into a void; they require interpretation and are often applied to particular concerns or issues.
I enjoy listening to baseball games on the radio. The pace of the game, the voices of the announcers, and the ability to do other things while listening add up to an enjoyable experience.
Except for one growing trend: the number of commercial reads throughout the game. At this point, it seems like almost every baseball event has a sponsor. Strikeouts, walks, doubles, home runs, the fifth inning, the seventh inning…you get the idea. Baseball has a lot of small events and apparently they can be attached to an advertiser for the right price.
I am aware of multiple factors behind this. Radio is a dying business. Live sports is one of the few shining spots where there are certain to be listeners (or viewers). Commercialization is alive and well. There is money to be made here.
But, I can only imagine how this might spread to all areas of life. Go beyond the Internet and social media ads tied to your browsing and shopping habits. You tie your shoes; brought to you by [blank]. You run the dishwasher; brought to you by [blank]. You read a book; brought to you by [blank].
At this point, there do not seem to be any officials guardrails against more and more of this happening. People can push back but this has consequences. If I do not like the baseball ads, I can stop listening. But, if we move to more immersive devices – Google Glass, virtual reality headsets, a house full of Internet equipped objects – this will be very hard to push against or escape.