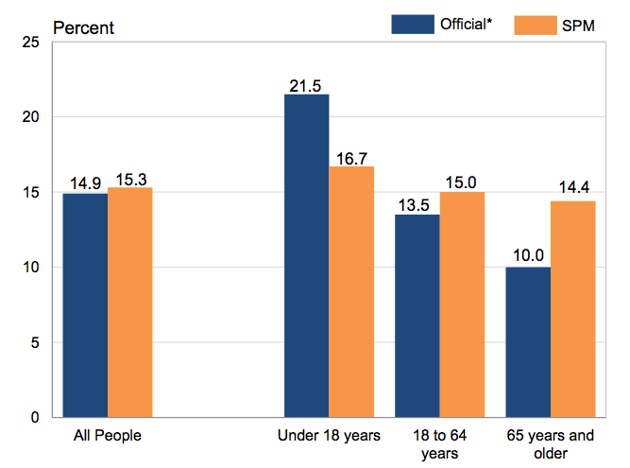
That’s why for the first time, the bureau released a supplemental poverty measure along with its official figures. According to the supplemental data, the poverty rate in the U.S. was about 15.3 percent—0.4 percentage points higher than the report’s official rate. But the additional measure shows differences in age groups. For instance, those under the age of 18 have a poverty rate of 16.7 percent—quite a bit lower than the 21.5 percent reported in the main findings. For older Americans, the tweaked metrics paint a grimmer picture, with the share of seniors living in poverty reported as nearly 5 percentage points higher than the official measure.
Poverty Rates: Official Versus Supplemental
Census
The more inclusive measures might help monitor the effectiveness of programs meant to increase the well-being of specific populations, such as children or the elderly. Still, the use of an official, blanket income level remains a crude means of identifying families that are having a difficult time putting roofs over their heads or food on the table, especially considering the vast differences in cost of living around the country. To better understand the persistent poverty problem requires greater attention to nuanced and localized data that can better illustrate areas where the cost of essentials are outstripping income and benefits, and where families continue to suffer.
An interesting development. Now the vetting of the new measurement tool can begin and I’m guessing that this won’t satisfy too many people.
A political question: would any administration allow the official government definition of poverty to change if it meant that the rate would increase during their time in office? This isn’t just about measurement; there are political considerations as well.