This story highlights an interesting gap in who knows their neighbors. Yet, this statistic is brought up so you can make sure you are not paying their utility bills. First, the statistic:
However, chatting to your neighbors is not as common as it used to be. A Pew Center study shows that fewer young Americans are familiar with their neighbors. Among adults under age 30, about a quarter (23%) claim to not know any of their neighbors, compared with 4% of those aged 65 and up.
Why might it be useful to know your neighbors?
That’s what happened to Brooke Patterson. She took to TikTok to explain how she realized that she had apparently been paying for her entire apartment building’s utility bills — for two years.
The gap cited above could be the result of multiple factors. People 65 and up might have lived in places longer. They had different social norms regarding neighborly interaction. They might not rely on technology as much in order to interact with people.
Is the primary goal to knowing your neighbors to save money? Or others might suggest your neighbors could help you look out for your property. Other primary goals for knowing your neighbors could include acting neighborly – looking out for each other, offering aid when helpful – and building community. That could come with cost savings down the road or even positive money if the character of the neighborhood helps boost property values. This might be another difference over time: what people hope to gain through social interaction.
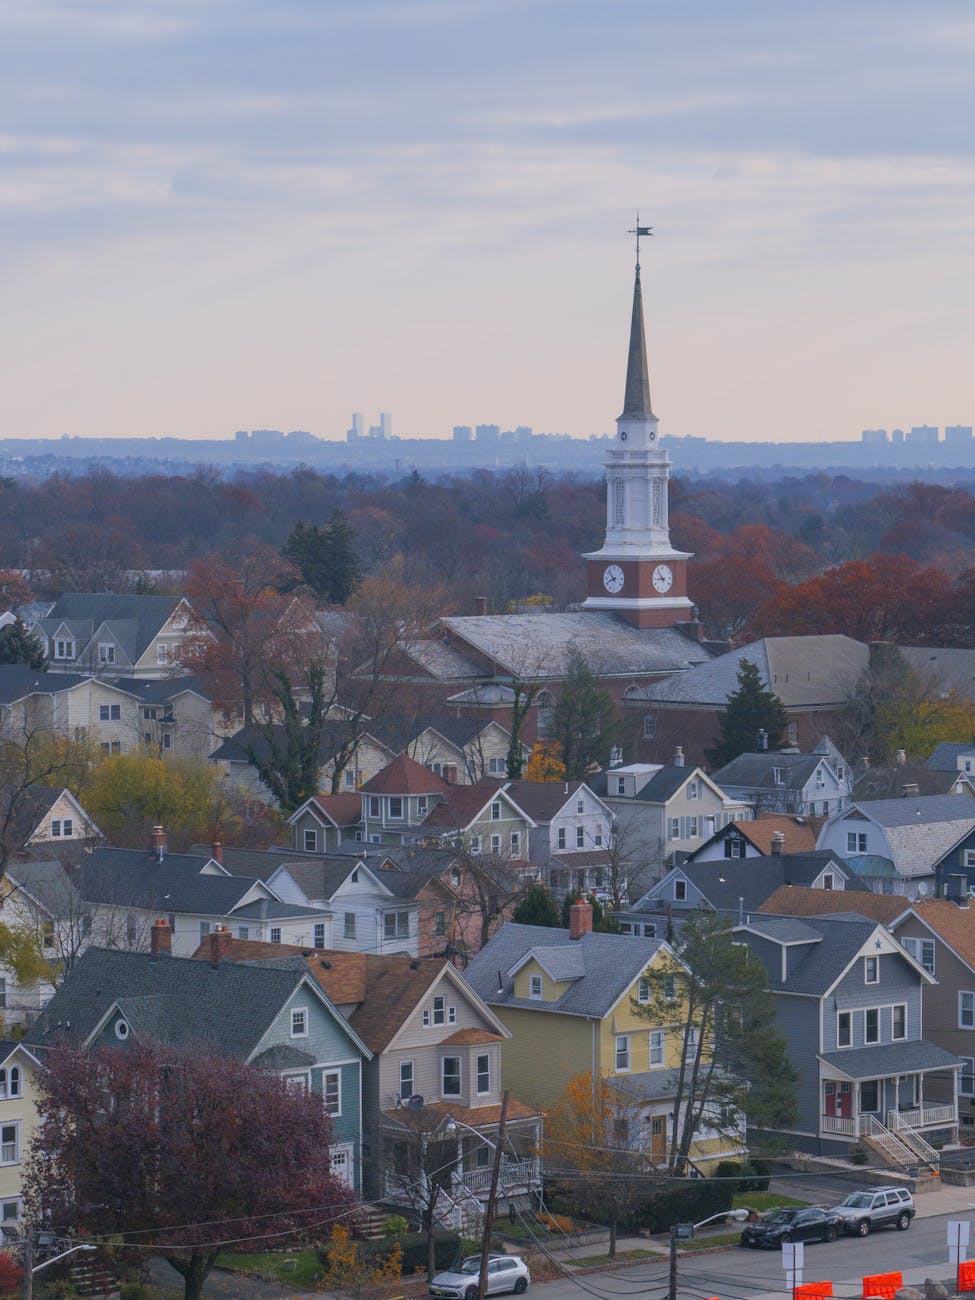
I was recently asked about the history of the development of suburbs in the United States. Here was my brief answer regarding important factors in that history (not exhaustive, not ranked in a particular order):
The importance of single-family homes and private property that started in the mid-1850s with the idea of a little cottage in the woods.
Anti-urban and pro-small town sentiments among Americans. These particularly developed as American cities start growing rapidly in the 1800s. Suburbs offer access to cities and their amenities while retaining some qualities of smaller towns like less distance between residents and local government.
Race, class, and gender. This includes: white flight of residents, businesses, religious congregations, etc. from cities to suburbs; the idea of a suburban middle-class who should live a particular lifestyle in the suburbs; and expectations about nuclear family life in the suburbs.
Government policy that consistently promoted suburban life including changes to mortgages in the first half of the twentieth century and largely funding the federal interstate system (while also putting less money into public housing, public transportation, etc.).
The role of transportation technologies enabling faster travel from further distances (railroad, streetcars, automobiles). This gave rise to commuting, further separation of work and home, and suburban lives oriented around driving everywhere.
These factors are not new to this blog or the scholarship on suburbs. However, limiting the number of factors to five does make it interesting in terms of thinking through important factors. (See a related post: Why Americans Love Suburbs – seven reasons.)
Communities was used five times. This phrase covers a lot of potential places. Here are two uses: “Thanks to our Bipartisan Infrastructure Law, 46,000 new projects have been announced across your communities—modernizing our roads and bridges, ports and airports, and public transit systems.”; “Taking historic action on environmental justice for fence-line communities smothered by the legacy of pollution.”
Cities and towns was used twice. This presumably refers to both places with more residents and those with fewer. Here are several uses: “It doesn’t make the news but in thousands of cities and towns the American people are writing the greatest comeback story never told.”; “Help cities and towns invest in more community police officers, more mental health workers, and more community violence intervention.”
Urban, suburban, rural was used once (and mentioned communities): “Providing affordable high speed internet for every American no matter where you live. Urban, suburban, and rural communities—in red states and blue.”
These uses are likely trying to cover as many different places in the United States at once. I imagine few Americans would not fit into one of these places described. A community could refer to municipalities, geographies, and other social groups that would use this term to describe themselves. Cities and towns covers bigger and smaller places. Urban, suburban, rural is a common set of categories that refers to different places and ways of life.
Are these the most effective terms to use when talking to a broad audience of people in the United States? When people hear these terms, do they recognize their own communities?
Cash aid without conditions was considered a radical idea before the pandemic. But early results from a program in Stockton, Calif., showed promise. Then interest exploded after it became clear how much COVID stimulus checks and emergency rental payments had helped people. The U.S. Census Bureau found that an expanded child tax credit cut child poverty in half. That is, until the expansion ended and child poverty spiked.
Around the country, from big cities to rural counties, there’ve been more than 150 basic income pilots, and counting. Supporters say it works because people can spend the money on whatever they need most…
The pandemic also spurred cash aid because cities got their own pot of COVID relief money. Many are using that to fund guaranteed income pilots. Philanthropic donations are another major funding source, including from groups that have long organized direct cash payments to combat poverty in developing nations.
The pilots target low- to moderate-income people, from a few hundred to a few thousand households, and generally pay them $500 or $1,000 a month for a year or two.
Here is one way to think about such programs: the United States often focuses on helping people or social actors reach their top potential. Whether in education or in innovation, why not enable the top performers to be even better performers? But, another way to operate is to help raise the floor in areas like income so fewer people struggle. These programs seek to provide monies so that people with less income have more opportunities.
Given the outcomes of these programs plus some of the outcomes of the COVID-19 aid, my guess is that we will see more of this with hopefully positive outcomes for people and communities.
While in graduate school, I learned that data for sociology research could be found online. The Census had a website. The Inter-university Consortium for Political and Social Research had a website. Social media platforms were blooming with Myspace offering lots of activity to examine and Facebook launching. Still today in 2024, I continue to make use of both of these streams of data:
Datasets available online. The ability to look up accurate and detailed statistics is hard to overvalue. For example, I regularly access the Census website and The Association of Religion Data Archives for information. I experienced the flip-side in graduate school as well. On one research assistant project, I looked through World Health Organization statistics published in thick bound volumes by the United Nations. Presumably, some of these books still exist but the expectation is that such information should be available online.
Online activity as data. With the growth of the World Wide Web and social media, sociologists and others use what is online as research data. I have published a few works that draw on websites and online materials to examine patterns. Of course, online activity is not necessarily the same as offline activity but I think the so-called “virtual world” and “real world” overlap more than people sometimes think. Studying online activity can tell us about important online patterns and offline patterns.
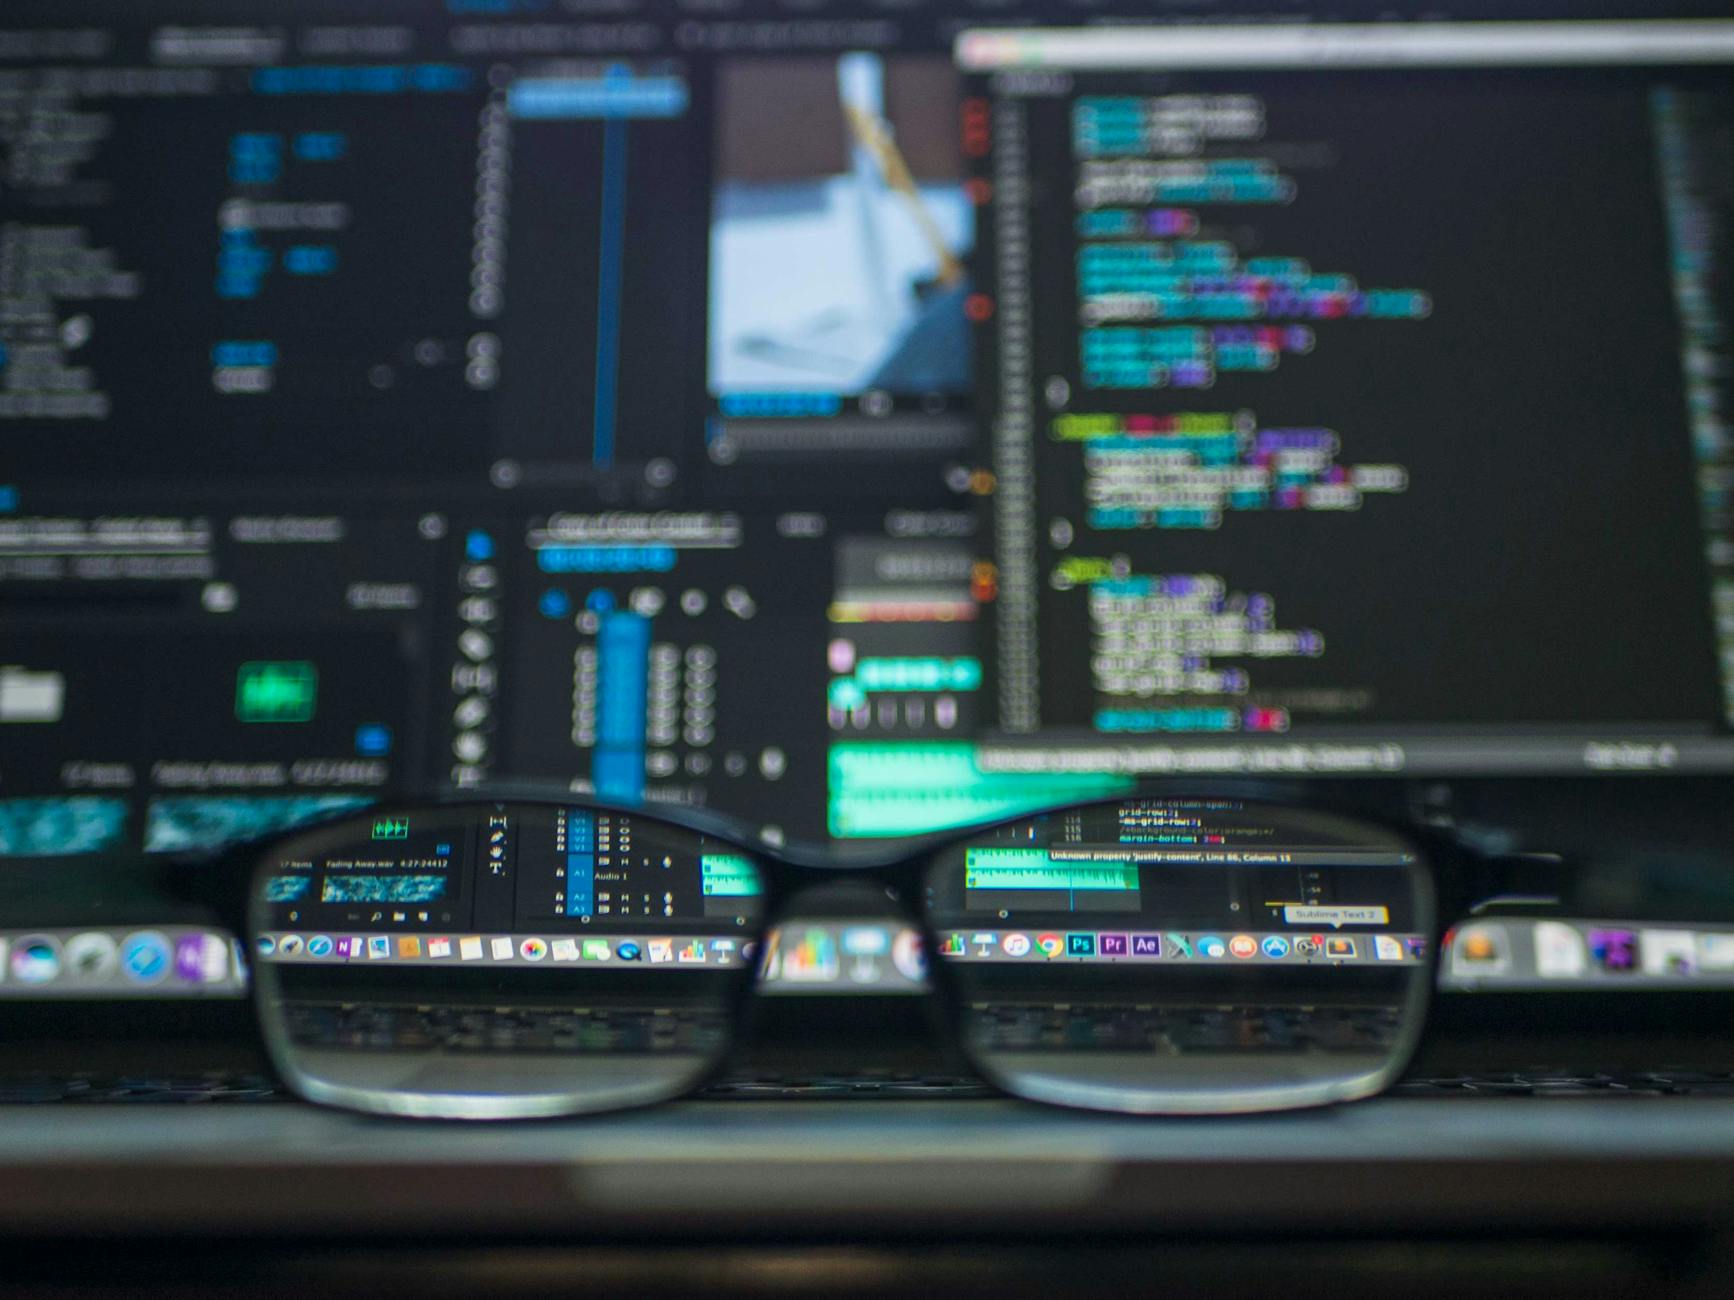
On the other hand, I did not have any specific training in graduate school about how to access this data online. Navigating websites and datasets online requires experience and know-how. Developing datasets from online activity takes work. A lot of methodological writing and advice can apply to online data but collecting data online can be its own process. What about having programming skills to speed up data collection and analysis?
I am sure there is a lot of research to come that will use both of these data streams to good effect. I look forward to the findings about society and social relationships to come.
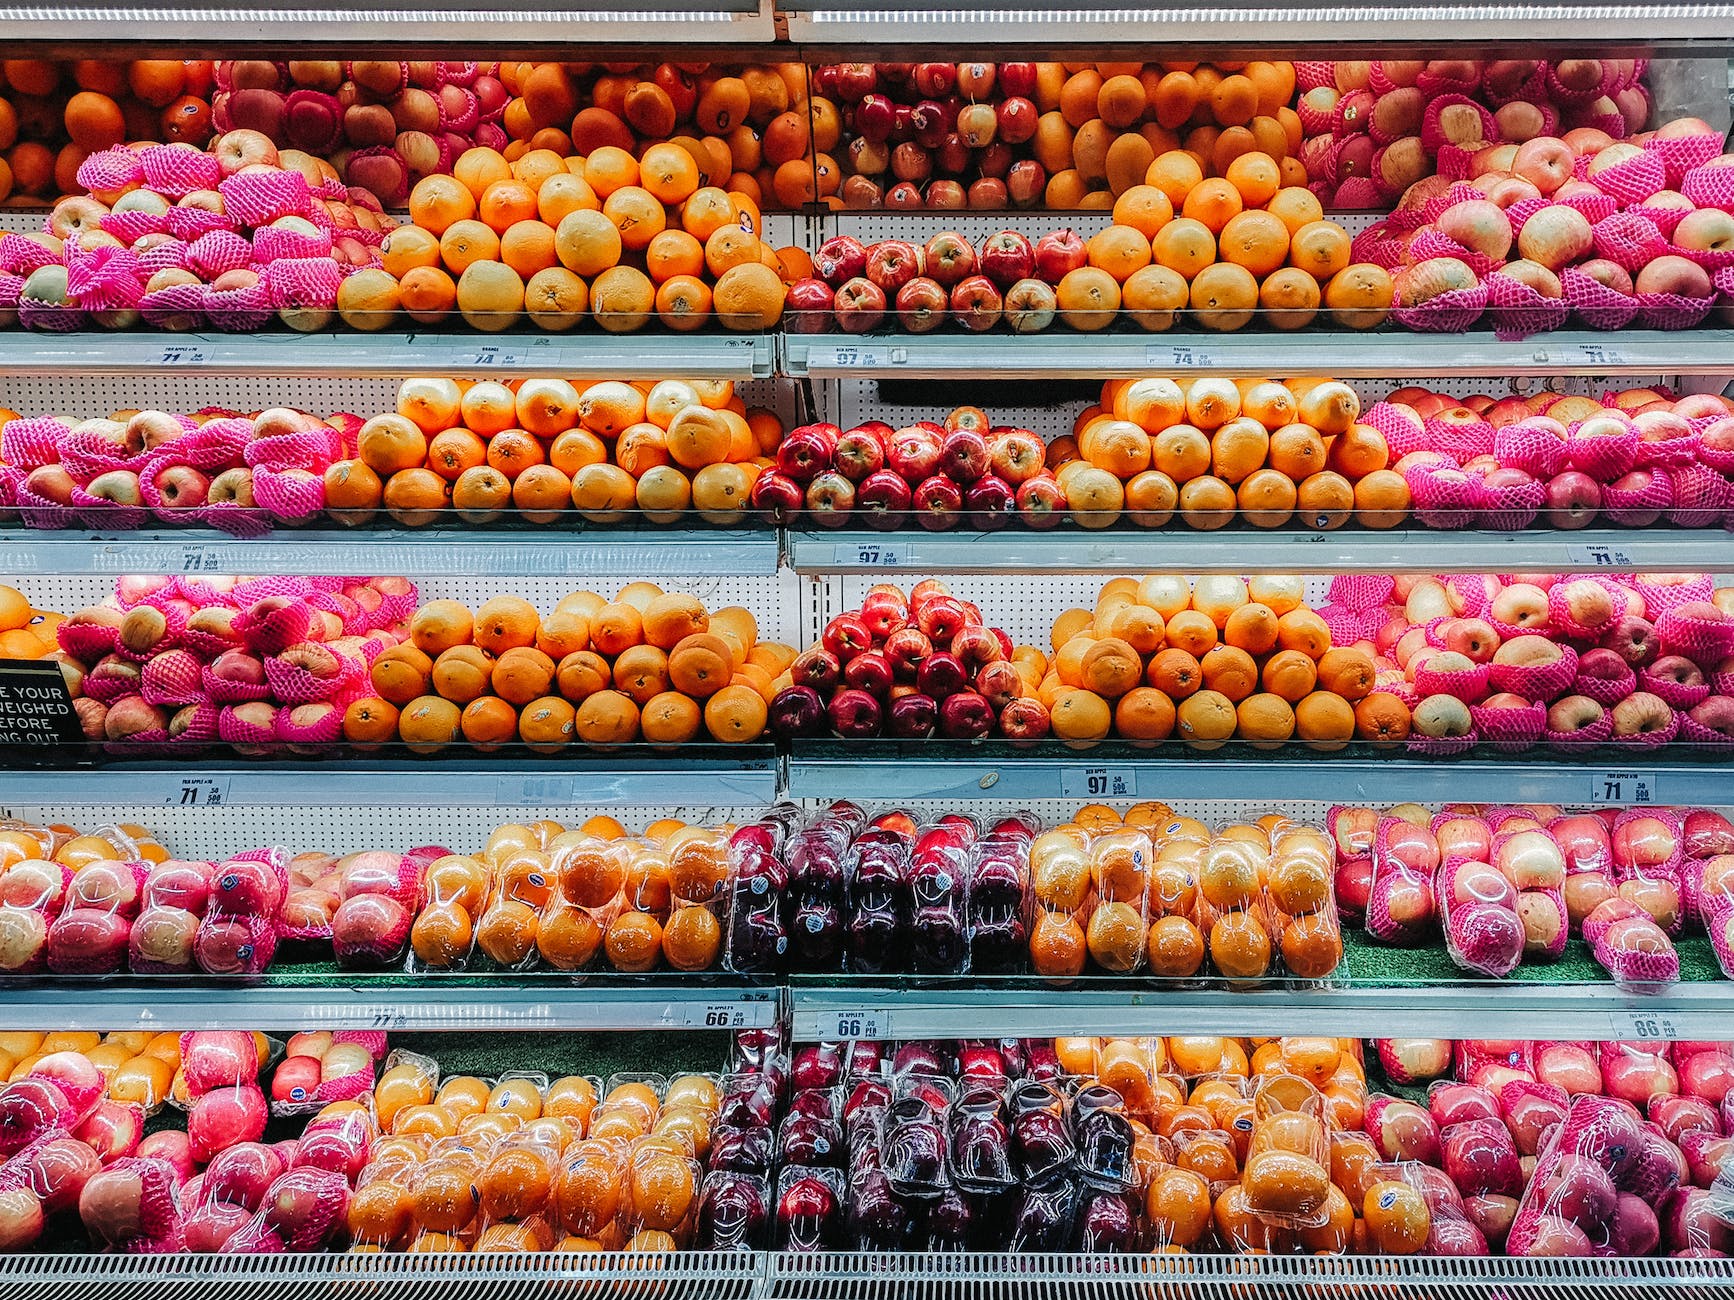
In his budget address in February, Pritzker proposed raising taxes by almost $900 million, but called for eliminating the 1% grocery tax as a regressive tax that hurts poor people.
Revenue from the tax goes entirely to local governments. The mayors laid out how that would affect their municipalities.
The change would cost retail-rich Algonquin around $2 million, about 10% of its budget, Sosine said, calling it “unacceptable.”…
Libertyville Village President Donna Johnson said the mayors are sensitive to financially strapped residents, but said the cuts affect basic services like police, fire, public works and roads…
In anticipation of such criticism, the governor’s office released a statement that it supports local government operations with more than $1 billion annually in additional funds from sources including an internet sales tax, gas taxes and transportation bonds.
Local governments have an ongoing balance to keep in generating revenues and then providing services to their communities. On one hand, they have mechanisms by which they can raise their own revenue. As noted above, the small grocery tax has generated some monies that municipalities count on. On the other hand, local governments receive revenue from other governmental bodies. As noted above, the state of Illinois provides monies to communities through a variety of means.
The concerns expressed by these local officials hint at both immediate concerns of needing to address a potential budget shortfall if the grocery tax is halted and long-term concerns of making sure state funds continue to go to communities. Cited elsewhere in this story is that the percent of income tax monies going to communities has dropped several percentage points in recent years.
What is the ideal percent of revenue for municipalities that should be generated within the community? (Is the correct answer something like 110+%?) Answering this question has consequences for zoning and land use decisions as well as what local governments will offer to residents.
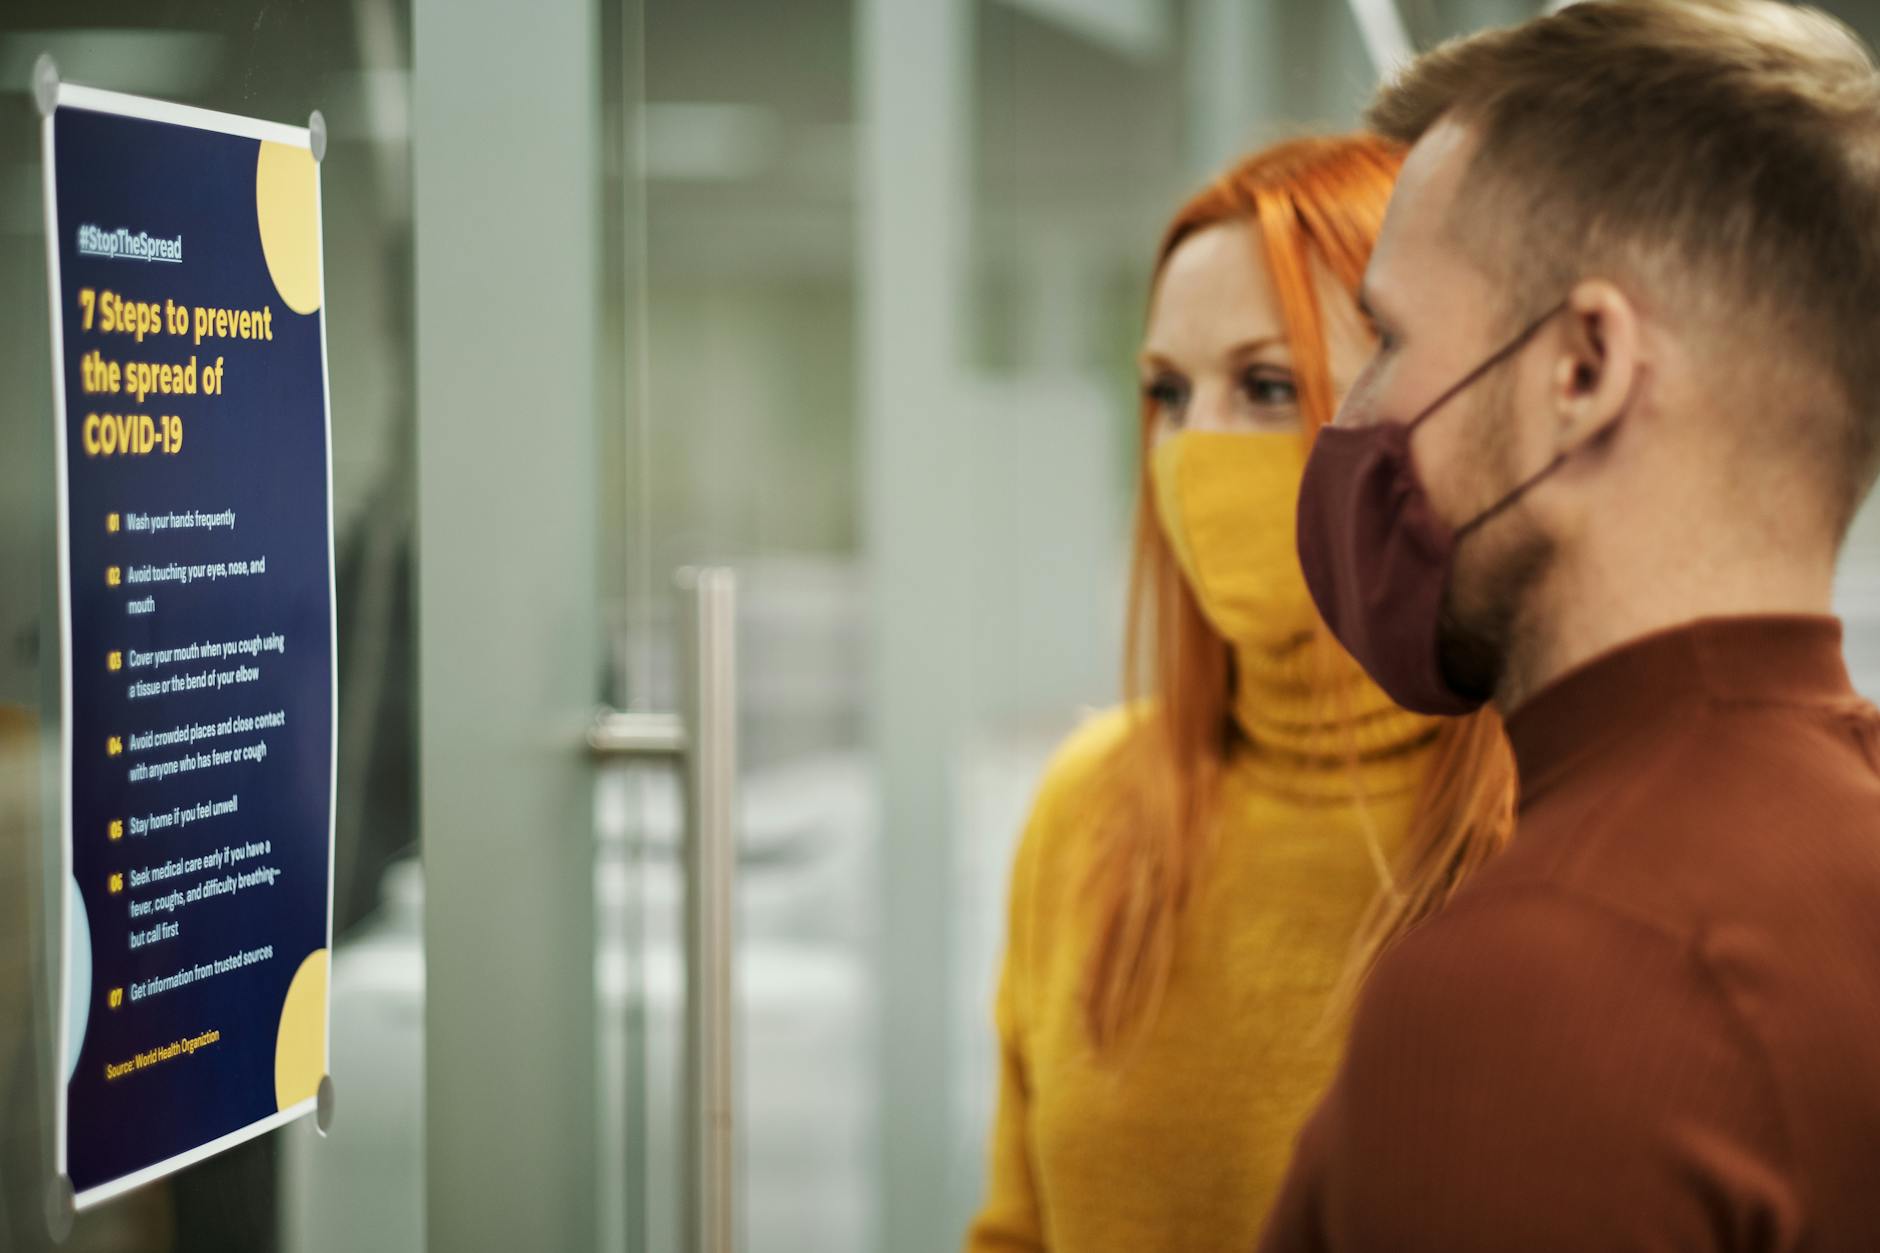
Beginning in 2020, COVID signage and equipment were everywhere. Stickers indicated how to stand six feet apart. Arrows on the grocery-store floor directed shopping-cart traffic. Plastic barriers enforced distancing. Masks required signs dotted store windows, before they were eventually replaced by softer pronouncements such as masks recommended and masks welcome. Such messages—some more helpful than others—became an unavoidable part of navigating pandemic life.
Four years later, the coronavirus has not disappeared—but the health measures are gone, and so is most daily concern about the pandemic. Yet much of this COVID signage remains, impossible to miss even if the messages are ignored or outdated. In New York, where I live, notices linger in the doorways of apartment buildings and stores. A colleague in Woburn, Massachusetts, sent me a photo of a sign reminding park-goers to gather in groups of 10 or less; another, in Washington, D.C., showed me stickers on the floors of a bookstore and pier bearing faded reminders to stay six feet apart. “These are artifacts from another moment that none of us want to return to,” Eric Klinenberg, a sociologist at NYU and the author of 2020: One City, Seven People, and the Year Everything Changed, told me. All these fliers, signs, and stickers make up the “ghost architecture” of the pandemic, and they are still haunting America today…
The contradiction inherent in ghost architecture is that it both calls to mind the pandemic and reflects a widespread indifference to it. Maybe people don’t bother to take the signs down because they assume that nobody will follow them anyway, Fessler said. Avoidance and apathy are keeping them in place, and there’s not much reason to think that will change. At this rate, COVID’s ghost signage may follow the same trajectory as the defunct Cold War–era nuclear-fallout-shelter signs that lingered on New York City buildings for more than half a century, at once misleading observers and reminding them that the nuclear threat, though diminished, is still present.
I have noticed these leftover signs as well. I recently spotted a retail shop with a sign saying that people without masks were not allowed inside.
There are numerous ways to pass along a message in a large complex society and signs are one way to do so. But, this assumes people will read the signs and then act on them. I have read a little about road signs and how too many signs can make for clutter and less attentive drivers. Is the same true for public health warnings in every public space? How well did people follow these directives? How many people follow the hand washing signs when they are posted in many restrooms (with specific warnings for employees)?
Another way to address this would be to redesign spaces so that there are fewer opportunities to be within such proximity to others or to limit the possible problems of proximity. However, many of our public and private spaces are pretty open. A bank lobby has lots of open space. Grocery stores have rows but these do not go up to the ceiling and checkout areas are right next to each other. Entertainment spaces, like movie theaters and stadiums, put people in proximity to others. And so on. It would be very difficult to address all of these and try to retain some sense of public interaction and space.
Former Goldman Sachs trader Jan Sramek unveiled his closely guarded ballot initiative for the proposed community between San Francisco and Sacramento in January, a plan that envisions 20,000 homes, transit infrastructure, schools, jobs and green space for an initial 50,000 residents. He has since amended it twice to address concerns raised by Solano County and a neighboring U.S. Air Force base.
Thursday is the deadline for the county counsel’s office to give the ballot initiative a title and summary, which will allow signature gatherers to hit the streets in search of the 13,000 they need — and preferably thousands more as a cushion. The delays mean the campaign has just two months, not three, to collect signatures if they want to give elections officials the maximum time to verify them…
“We’ve been walking a line of making sure we get this right and also realizing that the clock is ticking,” he said. “At the same time, we believe that the amendments that we made to the measure will significantly help increase our chances of success in November, and it was definitely worth the additional time that it cost us to get it right.”…
California Forever could have avoided this had the campaign shared its proposal with local officials ahead of time, said Ross, the consultant. “It’s very much an outsider approach,” he said…
The initiative specifies that the development agreement will include the 10 guarantees made by California Forever, such as $400 million to help county residents and Travis Air Force Base families buy homes in the community and $200 million for the county’s existing downtowns. An environmental impact review would also be required.
A friendly reminder: you cannot just start building a city or community in the United States. You may have been able to do this in the days before states or even afterward with more undeveloped land and smaller populations. But, at some point, communities had to appeal for incorporation. Later, they could appeal for home rule or other recognition.
Today, land use is governed by zoning guidelines at the county and municipal levels. Any change usually has to be approved by some body of local government. Local officials and local residents may disagree with developers and property owners about the best use of land. Some proposals are turned down while others are approved.
It sounds like this proposal has multiple local governments steps to proceed through. Will there be enough signatures to get on the ballot? Will it be approved by voters? What will local (and state) officials do? There is a long way to go even before any ground is broken.
The biggest point of contention between the two camps revolves around “unreported income,” more commonly known as tax evasion. Tax returns are the best data source available for studying income distributions, but they’re incomplete—most obviously because people don’t report all of the income that they’re supposed to. This information gap requires inequality researchers to make some educated guesses about how unreported income is distributed, which is to say, about who is evading the most taxes. Piketty, Saez, and Zucman assume that it’s the people who already report a lot of income: Think of the well-paid corporate executive who also stashes millions of dollars in an offshore account. Auten and Splinter, by contrast, assume that those who evade the most taxes are people who report little or no income: Think plumbers or housekeepers who get paid in cash. They believe, in other words, that members of the 99 percent are a lot richer than they look…
To take the true measure of inequality, economists need a way to account for all the income and expenses that don’t show up on people’s tax returns. The method that Piketty, Saez, and Zucman pioneered, and that Auten and Splinter follow, was to take the gross domestic product—a measure of all of the spending in the national economy every year—and figure out who exactly is receiving how much of it. (Technically, they use something called gross national income, which is a close cousin of GDP.) The benefit of this approach is that nothing gets left out. The drawback is that, well, nothing gets left out. GDP measures the total production of an entire economy, so it includes all sorts of expenditures that don’t seem like income at all.
Much of the difference between the authors’ estimates of inequality hinges on how they treat government spending on things that benefit the public at large, such as education, infrastructure, and national defense. Because this spending is part of gross national income, it must be allocated to someone in order for the math to work out. Piketty, Saez, and Zucman take the view that this stuff really shouldn’t be considered income, so they allocate it in a way that doesn’t change the overall distribution. Auten and Splinter, however, argue that at least some of this money should count as income. Citing research indicating that education spending tends to disproportionately benefit lower- and middle-income kids, they decide to allocate the money in a way that increases the bottom 99 percent’s share of income—by a lot. Austin Clemens, a senior fellow at the Washington Center for Equitable Growth, calculates that in Auten and Splinter’s data set, a full 20 percent of income for those in the bottom half of the distribution “comes in the form of tanks, roads, and chalkboards.”…
The deeper you get into how GDP is actually calculated and allocated, the more you feel as though you’ve fallen through a wormhole into an alternate dimension. Let’s say you own a house. Government statisticians imagine that you are renting out that house to yourself, calculate how much money you would reasonably be charging, and then count that as a form of income that you are, in essence, paying yourself. This “imputed rent” accounts for about 9 percent of all GDP, or more than $2 trillion. Or suppose you have a checking account at a major bank. Statisticians will calculate the difference between what the bank pays you in interest on that account (usually close to nothing) and what you could have earned by investing that same money in safe government bonds. That difference is then considered the “full value” of the benefits you are receiving from the bank—above and beyond what it actually charges you for its services—and is therefore considered additional income for you, the depositor. All of these choices have some theoretical justification, but they have very little to do with how normal people think about their financial situation.
These are common issues working with all sorts of variables that matter in life: trying to collect good data, operationalization, missing data, judgment calls, and then difficulty in interpreting the results. In this case, it affects public perceptions of income inequality and big questions about the state of society.
Is this just an arcane academic debate? Since academics tend to want their work to matter for society and policy, this particular discussion matters a lot. Every day, economic news is reported. People have their own experiences. Humans like to compare their own experiences to those of others now and in the past. People search for certainty and patterns. The question of inequality is a recurrent one for numerous reasons and having good data and interpretations of that data matters for perceptions and actions.
The way that academics tend to deal with this is to continue to measure and interpret. Others will see this debate and find new ways to conceptualize the variable and collect data. New studies will come out. Scholars of this area will read, discuss, and write about this issue. There will be disagreement. Conditions in the world will change. And hopefully academics will get better at measuring and interpreting the concept of income.
The state’s film production tax credit allows qualified productions to receive a 30% transferable tax break on most production costs and certain salaries. Producers can also receive 15% more for hiring workers living in “economically disadvantaged areas.” In return, these productions generate jobs and draw business from outside the region.
According to a new report commissioned by Dudley’s group, the state’s film incentive is the biggest box office draw for Hollywood. A survey of producers included in the report indicates more than 90% of the productions shot in Illinois would not have occurred without the incentive…
Producers of the television series “Fargo” used Elgin and other suburban locales as a stand-in for Kansas City a few years ago. Acclaimed director David Fincher turned downtown St. Charles into upstate New York for his recent Netflix film, “The Killer.” And parts of Warrenville and Lockport are used as substitutes for Manhattan, Kansas, in the HBO series “Somebody, Somewhere.”…
Yet, it still is a strange experience to see a location you recognize on-screen that is supposed to be somewhere else. Imagine you live in a suburb listed above. These communities have their own history roughly 30-40 miles outside of Chicago. They exist alongside dozens of other suburbs. But, you could be watching what is supposed to be Kansas City and you recognize this suburb. Or, Manhattan, Kansas is on-screen and it happens to look like Lockport. Do these geographic switches make the on-screen presentation less real? How many people notice the disconnects?
The article also emphasizes the role of finances: tax breaks help drive where filming takes place. I assume there are also efforts to try to make sure the stand-in location looks similar to what is supposed to be depicted. Do certain suburbs make good stand-ins for all suburbs or are particular metropolitan regions good to offering the variety of locations studios might want?