Is the average the best measure? With credit card debt possibly ranging from $0 to who knows how much, is the average a good measure of what is typical?
A recent GOBankingRates survey found that 30% of Americans have between $1,001 and $5,000 in credit card debt, 15% have $5,001 or more in credit card debt and about 6% have more than $10,000 in credit card debt.
Unfortunately, most people with an active credit card account don’t always pay their bills in full. A November 2022 LendingTree survey found that just 35% of cardholders say they always pay their credit card balance in full every month, while 65% say they carry a balance at least some of the time. Nearly half (46%) of those cardholders who have card debt say it would take them at least a year to pay it off.
And tables on this site based on 2019 Federal Reserve survey data suggest the median credit card debt is quite a bit lower than the average.
I am guessing the median credit card debt is a better measure of the typical debt as it better accounts for all the households without any credit card debt. There is a place for the average or the total amount of credit card debt, particularly if one wants to emphasize the growing amount of debt.
The theory that the aging population would require fewer homes isn’t quite accurate. It turns out older consumers tend to prefer smaller dwellings but not fewer homes. The Barclays housing team makes the argument that currently more boomers are partly responsible for creating more households, putting pressure on housing demand…
“Hence, as an increasing share of the population shifts into older age groups, more and more households tend to be formed. That is, as a given household head ages, the size of the household (in terms of people) tends to become smaller and smaller, with children moving out and couples separating because of divorce or death,” the economist added…
“Retired people always are much more likely to be the head of a household than those in pre-retirement age. This is because a given person in this age group is much more likely to be a single head of a household, especially as they, inevitably, lose a life partner,” Millar told Yahoo Finance in an email. “The difference now is that this generation is a much larger group than the one that preceded it, which means that they demand much more housing.”
That leaves less existing inventory for the younger ones, especially millennials as they reach an age where they would form a new household and buy a house.
Do Americans have to take up more houses just because there are more people? This gets at American ideas about single-family homes and households. Is it most desirable to spread out and have numerous private dwellings? Is this also a reflection of sprawling development in the post-World War II era?
If future generations are smaller in size, they could theoretically occupy fewer houses just by having fewer people. But, they could also decide to live in different ways. Fewer detached housing units? Denser settings, even in the suburbs?
This story is not over as population changes and desires for housing are dynamic.
A new generation of women is discovering the midcentury look, albeit for wildly varying reasons. Perhaps most divisively, there’s the “trad wife” movement, an online community of traditional women whose retro fashion reflects their religious, conservative and even sometimes far-right values. Then there are women who profess “vintage style, not vintage values,” combining hourglass silhouettes with a progressive worldview. And then there are those women and designers who just happen to appreciate the bygone charm of a swirly skirt…
The contemporary interpretations of 1950s fashion run the gamut from a sprinkle of yesteryear—winged eyeliner, a Grace Kelly headscarf, cat-eye sunglasses—to full-on June Cleaver dress-up. Fans of the look share makeup tutorials and life philosophies on TikTok. On
Pinterest, the somewhat disturbing tag “Stepford wife” includes images of Nicole Kidman in the spooky 2004 remake alongside black-and-white photos of women vacuuming. On Etsy, a gateway to the style, vintage hounds source period pieces, as well as replicas from purveyors like “Hearts and Found” and “Son de Flor.”
The 1950s housewife look isn’t limited to online rabbit roles and vintage shops. It’s also bleeding into high-end runway fashion. Prada has long made ladylike pieces like full skirts, capri pants and fitted sweaters cornerstones of its line, and Dior’s fall 2023 collection played up the house’s heritage of hourglass shapes.
Missing from this discussion is any explicit mention of the suburbs. The suburban lifestyle of the 1950s was a particular one. Even as it suggested middle-class success, it was not home to all nor offered equality. The country was relatively prosperous. The examples of fashion images from the era hint at the suburbs, whether it is Leave it to Beaver or I Love Lucy (two shows part of a study I published on TV shows set in the suburbs) or The Stepford Wives or Barbie (who has a dreamhouse).
The suburbs have an ongoing legacy that plays out in all sorts of contemporary issues and conversations. That it should be part of fashion should not be a surprise, even if it may not appear obvious to start.
Can one property help highlight the changes in Naperville, Illinois in the last century? I ran into this news item first published May 30, 1946 in The Naperville Sun:
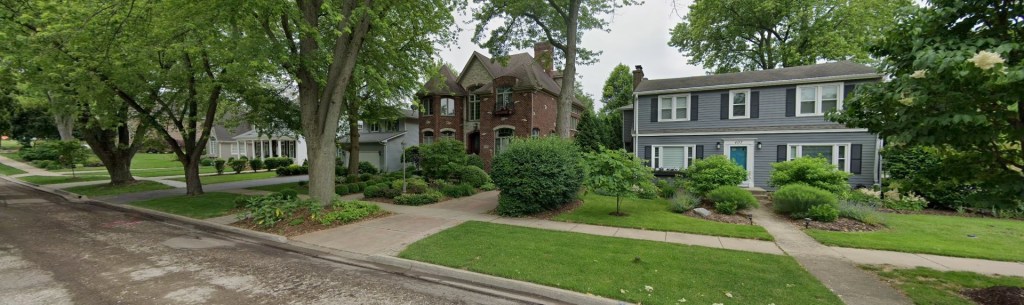
The Moser Fuel and Supply company has just completed the first new house to be built in Naperville since the outbreak of the war in 1941. This “No. 1” house, as it is referred to by Moser employees, is at 417 S. Sleight St., and is a little dream in brick veneer with chocolate-color mortar. Ten other Moser houses are going up around No. 1, eight of which are in the 400 block of south Sleight Street and two on South Wright Street.
According to multiple real estate websites, the current house on the property was constructed in 2004 and is worth over $1 million. Here is a June 2019 Google Street View image of the block, including the newer home on the property:
Several patterns worth noting:
-Naperville was a different place after World War Two: much smaller in population, lots of farms and agriculture around.
-Harold Moser and his firm ended up building thousands of units in Naperville. Moser Highlands, one of his first subdivisions, is just south of this location. He and his wife are honored in a statue along the Naperville Riverwalk:
-There are lots of teardown homes in Naperville, particularly near the downtown. As Naperville expanded in population and its status grew, some of the older suburban homes built decades earlier gave way to larger structures. I studied patterns in some of these new homes in a 2021 article.
But roadkill is also a culprit in our planet’s current mass die-off. Every year American cars hit more than 1 million large animals, such as deer, elk, and moose, and as many as 340 million birds; across the continent, roadkill may claim the lives of billions of pollinating insects. The ranks of the victims include many endangered species: One 2008 congressional report found that traffic existentially threatens at least 21 critters in the U.S., including the Houston toad and the Hawaiian goose. If the last-ever California tiger salamander shuffles off this mortal coil, the odds are decent that it will happen on rain-slick blacktop one damp spring night.
But, it has costs. It is expensive. Driving pollutes. It is part of sprawl. And it is dangerous to life, whether other drivers or pedestrians or animals.
There may innovative solutions. See the construction of bridges or overpasses over roads and highways that enable wildlife to cross roads without danger.
Yet, the danger to animals appears to be a cost Americans are willing to bear for what driving brings. Whether it continues this way remains to be seen.
Rents in suburbs climbed 26% through this past July since March 2020, 8 percentage points higher than the gain in urban cores, according to a report from rentals website Apartment List. Suburban-rent growth was greater than its urban counterpart in 28 of the 33 metro areas studied, the company said…
The widest rent gap was in Portland, Ore., which lost nearly 3% of its population between 2020 and 2022. Rents in Portland’s suburbs are up 23% since 2020, compared with about 2% in the center city.
Moves to the suburbs have continued despite a historically difficult for-sale housing market. The number of existing-home sales in July shrunk to its lowest level for that month since 2010, and prospective buyers continue to struggle with 7% mortgage interest rates and sale prices that remain near records.
Rents for single-family homes, meanwhile, continue to grow in most parts of the country. House rents in the Chicago, Boston and Orlando, Fla., metro areas each rose more than 5% in June compared with a year earlier, according to data firm CoreLogic. Green Street, a real-estate research firm, predicts single-family-home rental landlords will post the highest returns of all real-estate owners this year.
Though apartment asking rents are declining slightly in 2023, on average that drop has been felt less in suburbs, Apartment List said. Rents in suburban towns around Charlotte, N.C., and St. Louis, for example, are still growing, while in adjacent urban cores, growth in rents now runs negative, when measured annually.
Whether this persists long-term will be interesting to see. Will people shift from renting to owning when conditions are more favorable? Are more suburban communities open to rental units rather than focusing development efforts on single-family homes?
That’s why a group of researchers from Chile, Italy, Israel, Russia, Slovenia, and Spain recently collaborated to understand the mathematics behind “six degrees of separation.” They discovered that a natural human social challenge– weighing the costs versus benefits of social ties– may point toward the root of “the magic number six.”
Take a moment to think about why social networking is so coveted– in both work and recreation. Oftentimes, individuals hope to gain something, whether that be status or prominence, by identifying strategic social connections.
In these cases, people aren’t just hoping to accumulate a massive number of connections. Instead, they’re looking to find more meaningful “right” connections– which will essentially place them in a middle-network position and allow them to funnel more information flowing through their network…
At the heart of this game is the goal of social centrality, and once this battle reaches a sort-of equilibrium, all people involved have secured a position in the network that balances their drive for status against their budget for friendships.
“When we did the math, we discovered an amazing result: this process always ends with social paths centered around the number six. This is quite surprising,” explained Professor Baruch Barzel, one of the study’s lead authors.
I wonder what people might think if they saw this explanation of social relationships: it is a tradeoff between a central position in a network and how much they can spend on relationships. In some ways, we hear this in discussions of social networking where the goal is to create a lot of connections and a good flow of information and resources to you. On the other hand, viewing relationships as commodities or as transactional seems disrespectful and cruel.
Do we know that number six has always been the value or has this changed over time given social changes, settlement patterns, and other factors that differentiate life in different periods and contexts?
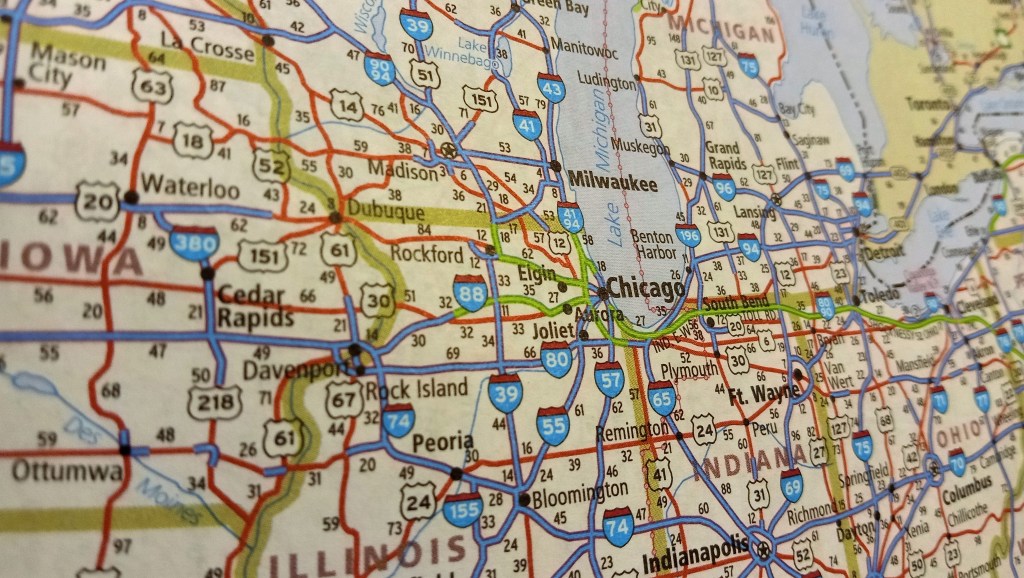
Apps are invaluable when you miss your exit on the interstate or need the quickest route through gridlock. But dispensing directions in 10-mile increments on a tiny screen is not the same as spreading a U.S. map out and visualizing a journey.
Everyone has a “mental map … made up of both factual information about a place and also our own understanding and imagination about the place,” Maitha said. Paper maps help build that mental map and provide spatial awareness, he explained.
All of these options are aids to help humans. With a paper map or Waze, the external object is helping a person make sense of the physical world around them. Our brains could use the help as we get our bearings.
My sense is that the digital devices are very helpful in immediate information – what is the next step I take? – but not so great in providing the big picture. You can see a list of turns or a broad map. But, their primary value is right in front of the vehicle. The paper atlas or road map provides the big picture while not saying as much about what is right outside the vehicle.
Just recently, I spent some time examining a 1718 map of North America made by a French cartographer. In working on some research involving these areas, the paper map provided a sense of how the French viewed this part of the world. It does not provide granular detail but it hints at what they thought was important.
Like some of the people interviewed in this article, I will keep both my atlas and my devices with me while driving. Until the device can unfold a larger image of the full scope of a journey, I want that option and will continue to enjoy maps and atlases.
Catalyzed by the pandemic, the demise of corporate campuses has created a development explosion, as dormant office space is transformed into industrial use for the digital age. Data centers provide the infrastructure for online commerce, while logistics centers deliver the goods to your doorstep.
The warehouse facilities also deliver tax revenue for municipalities, construction jobs and depending on the use, some permanent jobs as well. But the economy-boosting days of 5,000 employees descending on a community may be a thing of the past…
Chicago has the most transportation, distribution and logistics firms in the U.S., and Illinois ranks No. 4 among states with 20,500 companies employing more than 331,000 people, generating nearly $39 billion in annual economic output, according to Intersect Illinois.
In October, with many of its 5,400 Chicago-area employees working remotely, Allstate sold its north suburban corporate campus along the Tri-State Tollway for $232 million to Dermody Properties. The Nevada-based developer is turning the 232-acre property, which was annexed by Glenview, into a 10-building, 3.2 million-square-foot logistics park…
The project, which is expected to cost more than $500 million including land acquisition, will be one of the largest urban logistics developments in the U.S., bringing a projected 1,900 jobs, a new streetscape and vastly different traffic patterns than the former insurance headquarters.
It is best to state this at the outset: empty properties are not desirable in suburbs. Even if something is paying the property taxes, empty properties decrease the status of a community and do not bring in additional benefits like jobs and tax revenues.
That said, many communities and suburbanites would see the trade from a prestigious headquarters or office park to warehouses as a big downgrade. They will not be fooled by calling them “logistics centers.” Gone are white-collar jobs and a Fortune 500 company. In are trucks, traffic, and blue-collar jobs. Gone are steel and glass buildings that signify progress and higher status. In are preformed panels and boxy structures. Residents like having goods delivered to them quickly but they do not necessarily want to see the fulfillment and delivery process happen next door.
The truth is that not every community will attract developers who want to build a large mixed-use development. Or, waiting for a developer who has an attractive idea and does not want too much public money might take a long time. Some communities will move faster than others to turn vacant structures into working properties. Others will resist and be able to turn down these options.
But, the spread of warehouses in suburban areas to even middle- and upper-class suburbs means changes for these communities. Once marked by pristine offices serving as status symbols, some of these communities will now be home to logistics centers sending out goods far and wide.
Brazil is set to overtake the U.S. this year as the world’s top corn exporter, reflecting both a bumper harvest and logistical breakthroughs such as the consolidation of northern export routes, which are boosting the competitiveness of the South American grains powerhouse.
Corn exports through Brazil’s northern ports, which use the waterways of the Amazon River basin to ship grains globally, are on track to beat volumes via the most traditional port of Santos for a third consecutive year, according to a Reuters analysis of grain shipping data.
The shift underscores how Brazil, which churns out three corn crops per year and still has huge expanses of under-used farm land, is finally overcoming some of the infrastructure bottlenecks that have long made it hard to get its bountiful harvests to global markets.
That and a new supply deal with China announced last year suggest Brazil may be opening a longer era of supremacy over U.S. corn exports, unlike the last time the Brazilians briefly grabbed the global corn crown during North America’s drought-hit 2012/13 season.
Three thoughts connected to this shift:
-The image of the Midwest in the United States often involves corn. Corn mazes, corn palaces, endless fields of corn. Does this diminish anytime soon in the Midwest? Does Brazil have similar regional and cultural connections to corn?
-One of the reasons Chicago grew rapidly and became a global city is because it became a center for buying, selling, trading, and shipping commodities like corn. Corn poured into the city and helped make it wealthy and influential. Now, activity involving commodities has increased elsewhere. Will the traders in Chicago be betting on Brazilian corn?


