Some American cities have seen no gain in housing values for decades, others with large gains

Looking at long-term data regarding housing values in different American cities shows large differences across places:

What drives these differences?

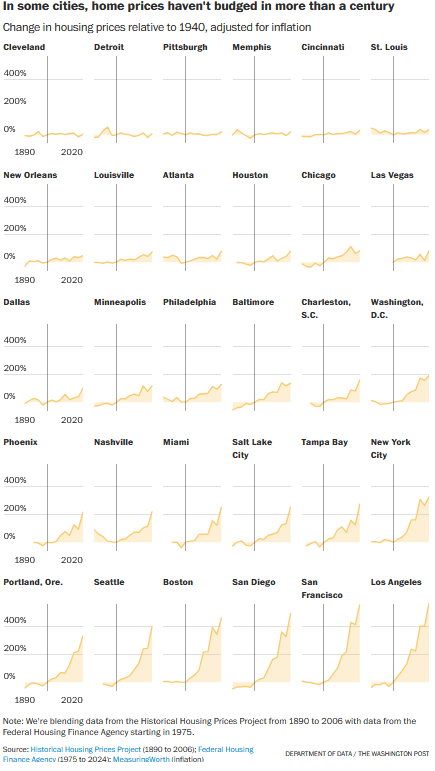
When we stopped to think about that, we couldn’t get it out of our heads. So many of us have internalized the lesson that homes are speculative, flippable investment vehicles, yet in much of the country — Cleveland, Memphis, Detroit, we could keep going — housing has been a truly quotidian commodity. There, home prices simply keep pace with inflation over the long run, no different from spaghetti or sprockets…

Consider that Dallas, Houston, Seattle and Portland, Oregon, all had what the researchers would classify as high demand for housing. But prices in Dallas and Houston have only roughly doubled in price since 1890, compared with a more than sixfold jump in Portland, or almost fivefold in Seattle…

“If prices go up,” Lyons asked us rhetorically, “does supply come on stream to follow? Do people look to build homes?”

Since 1970, the metros where housing stock grew the least relative to population growth — think Los Angeles, San Francisco, San Diego or Seattle — saw the some of the fastest home price growth. While metros that built enough housing — such as Atlanta, Phoenix and Charleston, South Carolina, saw home prices rise much less rapidly, even as their populations soared.

Does this suggest that Americans have come to view houses as investments when some places in the country have not experienced large increases in housing values over time?

For the cities with big increases over time, how do local leaders and residents see the jump in property values? It clearly leads to issues with affordable housing: rising housing values prices some people out of the market, particularly compared to what that market was and what residents had previously experienced. But rising housing costs can be viewed positively: people can sell their properties for more money and rising values can be associated with success.

This might be another reason why it is difficult to address housing issues at a national level. Housing is a very local issue and the cities in the top row of the graphic above have very different conditions compared to the cities in the bottom row.

The number of people needed to collect important inflation survey data

How many people participate in collecting data for a key inflation survey from the Bureau of Labor Statistics?

Photo by Mark Stebnicki on Pexels.com

The Bureau of Labor Statistics, the office that publishes the inflation rate, told outside economists this week that a hiring freeze at the agency was forcing the survey to cut back on the number of businesses where it checks prices. In last month’s inflation report, which examined prices in April, government statisticians had to use a less precise method for guessing price changes more extensively than they did in the past…

To calculate the inflation rate, hundreds of government workers called enumerators fan out across cities each month to check how much businesses are charging for products like blue jeans and services like accounting, largely by visiting brick-and-mortar stores. Statisticians in Washington, D.C. roll those figures together into the consumer-price index, a data stream that shows how the cost of living is changing for typical Americans.

If the government’s enumerators can’t track down a specific price in a given city, they try to make an educated guess based on a close substitute: say, cargo pants instead of slacks. But in April, with fewer workers on hand to check prices, statisticians had to base their guesses on less comparable products or other regions of the country—a process called “different-cell imputation”—much more often than usual, according to the BLS…

The inflation rate determines how much social-security benefits go up each year, and where federal tax brackets are set. Private-sector contracts such as wage agreements between companies and unions routinely reference the inflation rate. Payments on $2 trillion of inflation-protected federal bonds hinge on the inflation rate, as do yields on standard Treasury bonds. Businesses, investors and policymakers rely on the reading to guide their decisions. The Federal Reserve is laser focused on inflation data when it sets interest rates for the country.

Surveys require a lot of work to put together. Questions and methods need to be thought through and tested. Data needs to be collected. Analysis requires skill. Sharing results and interpretations is important.

The particular issues outlined above seem to have to do with (1) collecting data, which relies on going out and finding prices, and (2) dealing with missing data, which is related to #1 but is an issue for many surveys. If the survey is utilized by a large number of people, the choices made in the survey process can then affect decisions and policies.

It will be interesting to see what happens here. At what point do academics, policymakers, and others decide that the survey data may not be trustworthy? Which government surveys – and there are many – get priority for funding and having enough employees?

An American right to a good deal?

Amid inflation and high prices, the Chicago Tribune editorial board ended an editorial on prices at Starbucks this way:

Photo by Engin Akyurt on Pexels.com

It’s no sin to offer good value. Americans are practical people. We’re betting most of those who duck into a Starbucks would be pleased to see some special deals on the menu.

What American does not like a good deal? At the same time, Americans tend to say that the market sets prices. So what happens if prices seem unfair or unreasonable?

Two recent phenomena highlight this tension:

  1. Higher levels of inflation coupled with higher set prices. Is this fair? Sure, Americans keep buying during this time but they are spending more money on goods that used to be cheaper.
  2. High housing costs. Americans want to benefit as homeowners from rising property values but do not like paying high housing prices.

At what point do Americans deserve a good deal? Or when should non-market forces jump in to change conditions? This could depend on the particular context, leaders and influential actors, and what the public wants. Regarding the second example above, Americans have worked over decades to back up mortgages so that more people could pursue homeownership while not providing much public housing.

Even as Americans do not have a right to good deals, they tend to have at least some companies willing to offer goods or services at prices lower than others. This does not always occur and there are situations – such as with monopolies – where the government will step in. Without intervention, individual consumers are left trying to find a bargain or going without in a country devoted to consumerism.

American households lost trillions in 2022 due to stocks and inflation yet also gained trillions due to housing equity

A recent report detailing wealth losses in the United States also found housing equity increased in the first three quarters of 2022:

Photo by Pixabay on Pexels.com

American households lost about $6.8 trillion in wealth over the first three quarters of 2022 as the stock market shed more than 25% of its value, the Federal Reserve reported Friday in the government’s quarterly financial accounts.

Nominal net worth fell 4.6% to $143.3 trillion, as the market value of assets fell by $6 trillion and liabilities rose by about $900 billion. Households’ balance sheets were propped up by a 10% increase in home equity, which is the greatest source of wealth for most American families…

Homeowners, in particular, were in good shape financially as September ended, with the equity in their houses rising to a near-record 70.5% of market value from a record low of 46% in 2012. But if home prices continue to fall as they have done in the past several months, homeowners without much exposure to the stock market will begin to feel poorer. What will happen to home prices as mortgage rates rise is a major unknown facing policy makers and homeowners alike.

Homeownership continues to bolster wealth. This fits with the emphasis on homeownership as an investment. And if people cannot purchase homes, they will not be able to build wealth in the same way.

Thinking out loud: after what happened in the late 2000s with housing prices, how would people respond to a significant reduction in housing values? Or, how would this be received if inflation is ongoing and the stock market struggles? For now, some can rest assured that their homes will retain value. But, this is not guaranteed.

Why it can take months for rent prices to show up in official data

It will take time for current rent prices to contribute to measures of inflation:

Photo by Burak The Weekender on Pexels.com

To solve this conundrum, the best place to start is to understand that rents are different from almost any other price. When the price of oil or grain goes up, everybody pays more for that good, at the same time. But when listed rents for available apartments rise, only new renters pay those prices. At any given time, the majority of tenants surveyed by the government are paying rent at a price locked in earlier.

So when listed rents rise or fall, those changes can take months before they’re reflected in the national data. How long, exactly? “My gut feeling is that it takes six to eight months to work through the system,” Michael Simonsen, the founder of the housing research firm Altos, told me. That means we can predict two things for the next six months: first, that official measures of rent inflation are going to keep setting 21st-century records for several more months, and second, that rent CPI is likely to peak sometime this winter or early next year.

This creates a strange but important challenge for monetary policy. The Federal Reserve is supposed to be responding to real-time data in order to determine whether to keep raising interest rates to rein in demand. But a big part of rising core inflation in the next few months will be rental inflation, which is probably past its peak. The more the Fed raises rates, the more it discourages residential construction—which not only reduces overall growth but also takes new homes off the market. In the long run, scaled-back construction means fewer houses—which means higher rents for everybody.

To sum up: This is all quite confusing! The annual inflation rate for new rental listings has almost certainly peaked. But the official CPI rent-inflation rate is almost certainly going to keep going up for another quarter or more. This means that, several months from now, if you turn on the news or go online, somebody somewhere will be yelling that rental inflation is out of control. But this exclamation might be equivalent to that of a 17th-century citizen going crazy about something that happened six months earlier—the news simply took that long to cross land and sea.

This sounds like a research methods problem: how to get more up-to-date data into the current measures? A few quick ideas:

  1. Survey rent listings to see what landlords are asking for.
  2. Survey new renters to better track more recent rent prices.
  3. Survey landlords as to the prices of the recent units they rented.

Given how much rides on important economic measures such as the inflation rate, more up-to-date data would be helpful.

Inflation also affects infrastructure projects

Rising inflation in the United States is impacting large-scale infrastructure projects:

Photo by Markus Spiske on Pexels.com

The price of a foot of water pipe in Tucson, Arizona: up 19%. The cost of a ton of asphalt in a small Massachusetts town: up 37%. The estimate to build a new airport terminal in Des Moines, Iowa: 69% higher, with a several year delay.

Inflation is taking a toll on infrastructure projects across the U.S., driving up costs so much that state and local officials are postponing projects, scaling back others and reprioritizing their needs.

The price hikes already are diminishing the value of a $1 trillion infrastructure plan President Joe Biden signed into law just seven months ago. That law had included, among other things, a roughly 25% increase in regular highway program funding for states.

“Those dollars are essentially evaporating,” said Jim Tymon, executive director of the American Association of State Highway and Transportation Officials. “The cost of those projects is going up by 20%, by 30%, and just wiping out that increase from the federal government that they were so excited about earlier in the year.”

Because a number of these projects have to get done, it sounds like the primary effect of inflation is to delay projects. This has a cascading effect on getting better infrastructure in place, jobs, construction and its consequences, and more.

I wonder if there are any brewing stories where inflation plus cost overruns, which can happen on large complicated projects, lead to big price tags.

Google measures inflation by looking at web data

Once again drawing upon its access to  information, Google suggests it developing an alternative measure of inflation:

Google is using its vast database of web shopping data to construct the ‘Google Price Index’ – a daily measure of inflation that could one day provide an alternative to official statistics.

The work by Google’s chief economist, Hal Varian, highlights how economic data can be gathered far more rapidly using online sources. The official Consumer Price Index data are collected by hand from shops, and only published monthly with a time lag of several weeks…

The GPI shows a “pretty good correlation” with the CPI for goods such as cameras and watches that are often sold on the web, but less so for others, such as car parts, that are infrequently traded online.

This bears watching as Google can access data and then analyze/summarize it at a much quicker speed than the government. But it will be interesting to see how Google gets around the issue of what is being sold online – the story also notes that Google’s index downplays the role of housing.

This could play out in a number of ways. Could this online index be improved so that markets were responding to Google’s data rather than the government’s data? Let’s say the government decides it likes Google’s approach. Does it develop the same or a similar algorithm within the government? Does it contract the task to Google?