The populations of the “safest and wealthiest suburbs” in the US

A new list of high income and low crime suburbs has this top ten:

Photo by Phyllis Lilienthal on Pexels.com
  1. Western Springs, IL
  2. Lexington, MA
  3. Winchester, MA
  4. Whitefish Bay, WI
  5. Huntington Woods, MI
  6. Ottawa Hills, OH
  7. Winnetka, IL
  8. Kenilworth, IL
  9. University Park, MD
  10. Upper Arlington, OH

Here is how GOBankingRates.com developed the list:

GOBankingRates analyzed the top 1,000 cities by household mean income across the United States to find the safest and richest cities using data from the US Census American Community Survey, Bureau of Labor Statistics Consumer Expenditure Survey, Zillow Home Value Index, Federal Reserve Economic Data, AreaVibes, and the FBI. The property crime rate per 1,000 residents, violent crime rate per 1,000 residents, livability score, household mean income, and the average total cost of living were scored for each location and sorted to show the safest and richest cities. All data was collected on and is up to date as of August 4th, 2025.

Based on a recent post about the wealthy and large suburbs of the United States, including Naperville, Illinois, I was curious about the population size of the top ten communities. Here is their population according to Quick Facts:

  1. 13,600
  2. 34,400
  3. 22,900
  4. 13,700
  5. 6,300
  6. 4,500
  7. 12,100
  8. 2,400
  9. 2,400
  10. 35,300

Not all of these are small towns; some might even be considered small cities. All have household mean incomes of over $200,000.

Going further through the top 50 suburbs, few are really large. Naperville comes in at #49, the largest suburb by population on the list by far.

To make this list, a suburb does not have be small and exclusive. It can be slightly larger and exclusive. I wonder if this is due to using the household mean income rather than the median. The mean is more likely to be pulled up by a small number of really high earners while the median gets at the midpoint of the distribution.

If population growth in the US slows, this will make competition between cities for people even more intense

For cities and communities in the United States, growth is good. It signals progress, status, new development. To be flat in population or to lose residents hints at problems or failure.

Photo by Burak The Weekender on Pexels.com

Throughout the history of the United States, the growth rate each decade has been over 10% for every decade except for 4 (1930s, 1980s, 2000s, 2010s). The population growth came through births and immigration. This population growth means many communities could grow. Some places might lose people – such as several prominent cities in the second half of the twentieth century – but there was growth in many places.

So if population growth across the United States slows, how can many cities, suburbs, and metropolitan areas also grow? There will be fewer people to go around. This could lead to some different outcomes:

  1. There will be clearer “winners” and “losers” in population.
  2. Communities and commentators could adjust their image of how much growth is needed. They could adjust their expectations down.
  3. Americans could decouple population figures from their ideas about quality of life. Perhaps population change has little relationship with whether communities are doing well.

My guess is that #1 would lead the way as people are used to growth and the perceived benefits that go with it. #2 and #3 could happen but would take time as people adjust to different realities where growth is more limited and fewer communities can expand in population.

And if population growth is harder to attain, what might communities and governments do to try to encourage more of it? Bigger incentives? More advertising? Promoting particular amenities or quality of life concerns?

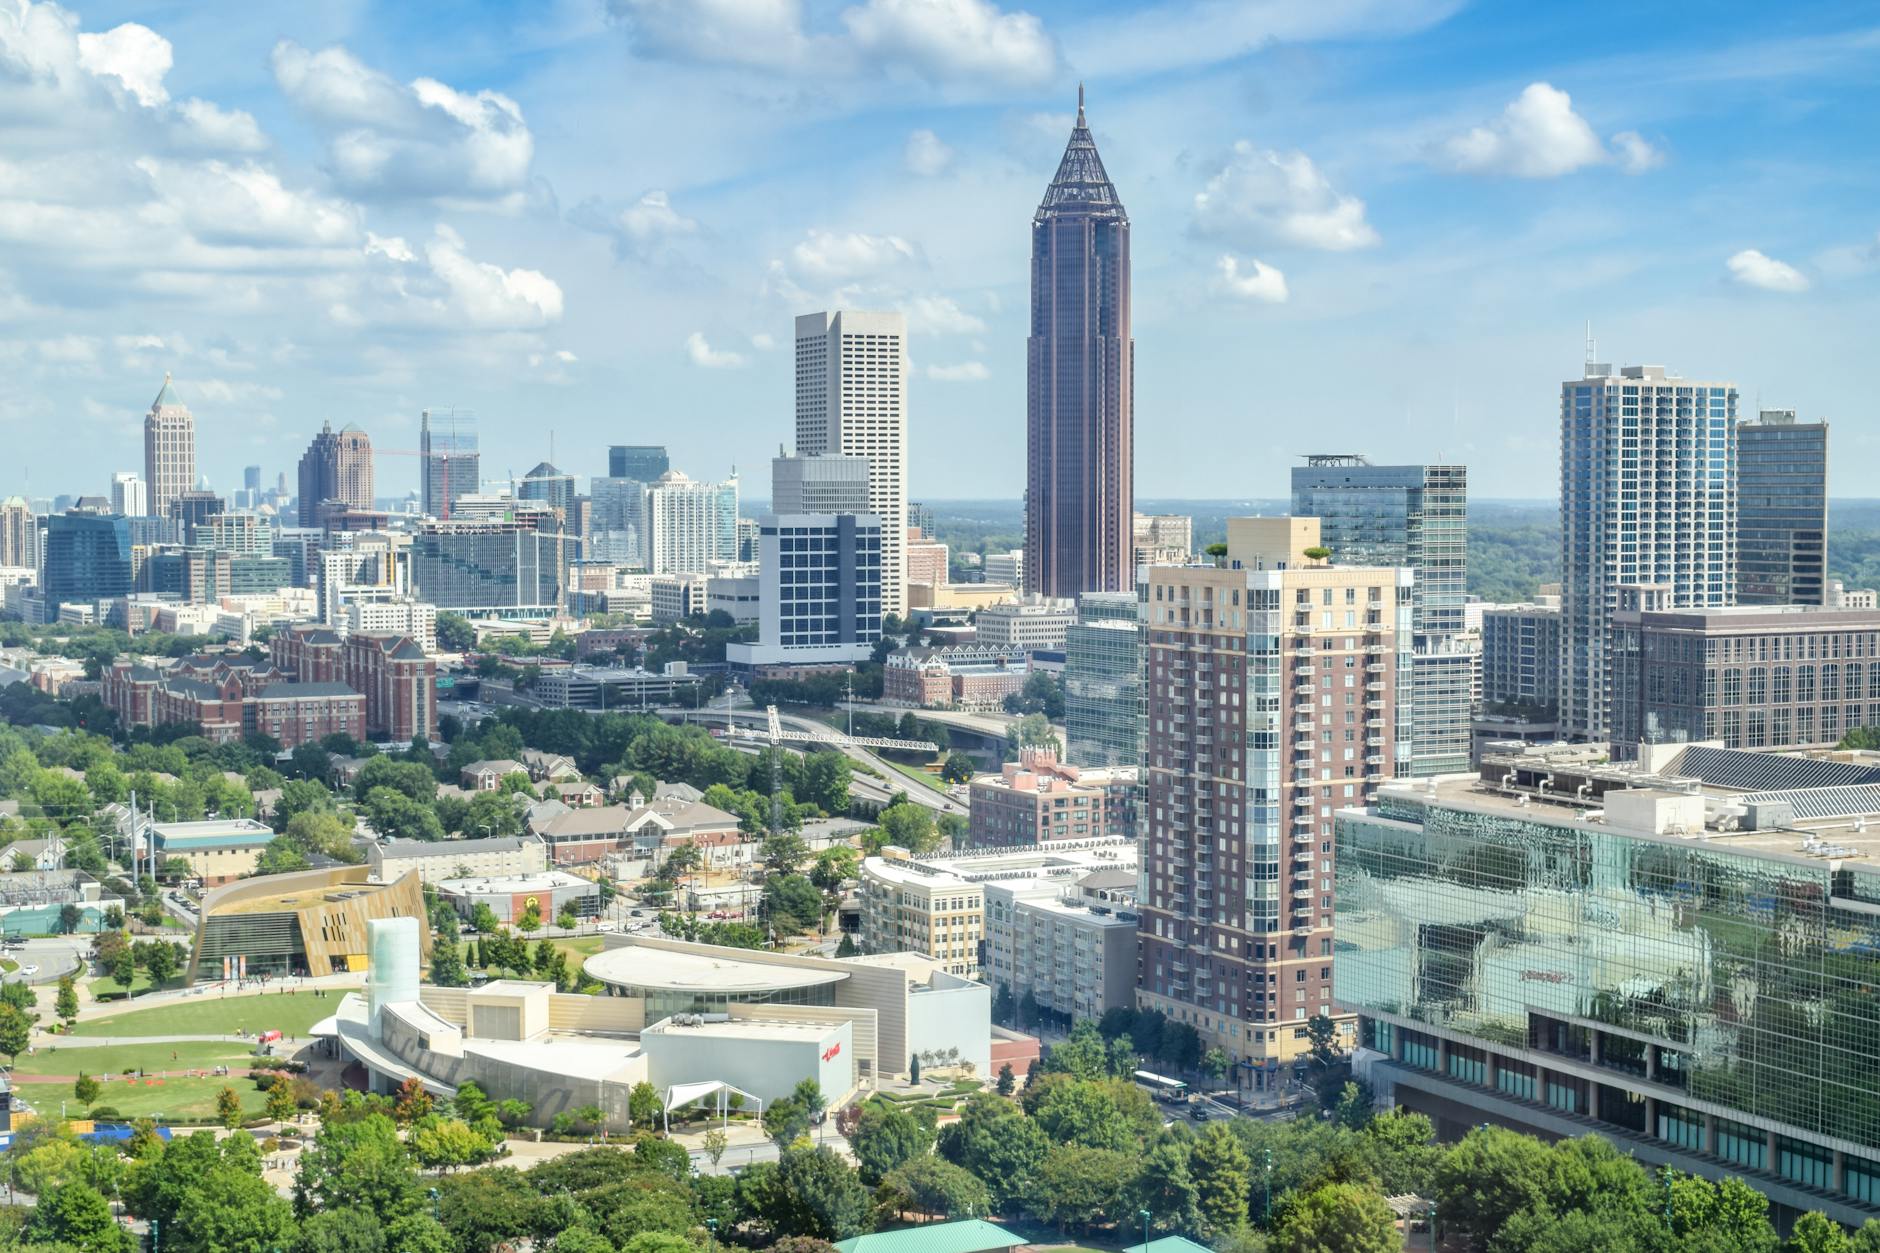
If the population growth of Atlanta has slowed, where are people going instead?

Recent data suggests that Atlanta is growing more slowly than in the past:

Photo by Nate Hovee on Pexels.com

Census data show more people from within the U.S. left metro Atlanta than moved to it during the 12 months that ended in mid-2024. It was a modest decline, about 1,330 people. But it heralds a significant moment for the longtime growth magnet: This is the first time metro Atlanta lost domestic migrants since the Census Bureau started detailing these numbers three decades ago.

If people are not moving to the Atlanta, where are they going instead? Here are some hints:

Growth in some other big Sunbelt metros has slowed, too, after pandemic-fueled population surges, including around Phoenix and Tampa, Fla., the census data show. Recent Bank of America change-of-address data also show big metros in the region losing steam…

“We just couldn’t afford to live there and have the lifestyle we wanted,” said Adelia Fish, 29 years old, who left suburban Atlanta with her husband in May for a newly built, three-bedroom home in Chattanooga, Tenn…

Whether that big-metro slowdown continues remains to be seen. But census data also indicate many smaller regions in the South—places like Huntsville, Ala., Wilmington, N.C., and Knoxville and Chattanooga in Tennessee—are picking up the slack. Their metros are all running ahead of pre-Covid trends.

The article hints at multiple reasons for this:

  1. Bigger metropolitan regions like Atlanta have advantages but they are at a point where the costs of living there are now higher – housing costs, traffic, limited housing options.
  2. Smaller metro areas can provide cheaper housing and a smaller scale.
  3. Certain jobs or careers are portable or can be done in multiple places, not just in the biggest metro areas.

What does this do to Atlanta and other places that have been used to growth for decades? It is about status – we are on the rise! – and about planning – continued demand for land and buildings leads to different options.

If these patterns continue, keep on eye on what metropolitan areas become the hot ones in the next 5-10 years. How do they respond to a new status and local changes?

Teams from the biggest metropolitan areas doing well in MLB’s first half

The first half of the Major League Baseball season is almost over. And big market teams are leading the way:

Photo by Tim Gouw on Pexels.com

Of the top 10 teams in playoff position, seven teams come from the top seven North American markets by population figures, according to the Census Bureau and Canada population sources. They are, 1) the New York Yankees and New York Mets, 2) Los Angeles Dodgers, 3) Chicago Cubs, 5) Houston Astros, 6) Toronto Blue Jays and 7) Philadelphia Phillies.

The three other teams in the top 10? Detroit, Tampa, and Milwaukee. According to one source, they rank as the #17, #24, and #outside of the top 50 most populous metropolitan regions.

A few other thoughts about this list:

  1. Mexico City is the largest North American market. Of course, MLB only has teams in the US and Canada (one team).
  2. Missing teams from the other largest markets: Dallas-Fort Worth, Atlanta, Washington, D.C., Miami.
  3. Metropolitan population may not compare exactly with market size. This listing of MLB market sizes has a slightly different order.
  4. All seven teams in the big markets play in stadiums in their city (not in the suburbs).
  5. The argument in baseball tends to go that the teams in the largest markets have the most money to spend. This could be connected to local media deals (the LA Dodgers with the biggest) or perhaps owners from certain places having funds or lots of fans attending games in certain places.
  6. But having money does not necessarily guarantee being in a bigger market or winning a World Series. One analysis:

Since 1995, 48% of the champions and 38% of the contestants in the World Series have had top 5 payrolls. 93% of the champions and 83% of the contestants have been in the top half of payroll. Only two low-payroll teams have won it all — the 2002 Anaheim Angels and the 2003 Florida Marlins. It has been two decades since that has happened.

The list of losing World Series teams in the bottom half of payroll for the season includes the 2007 Rockies, 2008 and 2020 Rays, 2010 Rangers, 2014 Royals, 2015 Mets, 2016 Indians, and 2023 Diamondbacks.

Changing racial and ethnic diversity in the Chicago region

New estimates from the Census Bureau show changing populations in the Chicago region:

Photo by Kelly on Pexels.com

Metro Chicago’s Asian population is growing faster than any other racial or ethnic group, Census Bureau estimates show. Of the estimated 9.4 million people in the Chicago metropolitan statistical area in 2024, roughly 764,000 are Asian — almost 80,000 more than in 2020, data show. During that span, the Hispanic population also grew from about 2.22 million to more than 2.32 million. Meanwhile, the metro area’s white and Black populations both declined. White population fell from 4.83 million to 4.64 million, and the Black population declined from about 1.56 million to 1.50 million.

If these patterns continue, what significant changes could come to communities and the region? How does this affect residential segregation in the region (thinking back to the high levels of white-Black segregation documented in American Apartheid)? Or political representation and policies? Or day to day lives of residents? Looking at the regional level could obscure important differences at other levels.

I am also reminded how the city of Chicago has had roughly similar sized populations of white, Black, and Latino residents in recent years. Do the patterns above suggest that the city might be headed toward four groups being roughly evenly sized at some point?

US population growth driven by immigration

A new analysis suggest immigration fueled recent population growth in the United States:

Photo by Czapp u00c1rpu00e1d on Pexels.com

Immigration was the sole driver of the United States’ population growth in a single year for the first time since records began, a new study released Wednesday said…

The U.S. immigrant population grew by 1.6 million between 2022 and 2023 to 47.8 million, according to the MPI analysis, with immigrants now representing a 14.3 percent share of the overall population—the highest ever.

Three quick thoughts:

  1. Population growth is good in the United States. To have flat population growth or decline in population would be viewed with concern. This is a perception issue.
  2. The country has never experienced a decline in population between decennial censuses. It did not have growth under 7% in any decade (just over this during the 1930s and 2010s).
  3. How many systems and sectors in the country would be harmed if population growth and/or immigration slowed or stopped? What would keep going and what would not?

A list of the 30 fastest growing wealthy suburbs includes two suburbs with population declines

I recently found a list of wealthy American with the most population growth. But I noticed that the list ends with two suburbs that lost population during the time period of interest (2018-2023). I suspect this might be because how they selected the communities on the list.

Photo by Altaf Shah on Pexels.com

Methodology: For this study, GOBankingRates analyzed suburbs to find the fastest-growing wealthy suburbs in America. First GOBankingRates found the places with a population between 25,000 and 100,000 according to the U.S. Census American Community Survey. The metro area for each location was found and only the metro areas with a population of 1 million or more were kept. With these suburbs isolated, the numerical and percentage change in population from 2018 to 2023 were found for each city using data from the American Community Survey Census from 2018 and 2023. For each location, GOBankingRates found total population, population ages 65 and over, total households, and household median income all sourced from the American Community Survey. Only places with a median household income of $150,000 or more were kept for this study. Using this data the percentage of the population ages 65 and over were calculated. The cost-of-living indexes were sourced from Sperling’s BestPlaces and include the grocery, healthcare, housing, utilities, transportation, and miscellaneous cost of living indexes. Using the cost-of-living indexes and the national average expenditure costs, as sourced from the Bureau of Labor Statistics Consumer Expenditure Survey, the average expenditure cost for each location were calculated. The livability index was sourced from AreaVibes for each location and included as supplemental information. The average single-family home value was sourced from Zillow Home Value Index for November 2024. Using the average single-family home value, assuming a 10% down payment, and using the most recent national average 30-year fixed mortgage rate, as sourced from the Federal Reserve Economic Data, the average mortgage can be calculated. Using the average mortgage and average expenditure costs, the average total monthly and annual cost of living were calculated. The cities were sorted to show the highest percentage population increase first to show the places with the fastest-growing wealthy suburbs in America. All data was collected on and is up to date as of Jan. 6, 2025.

The bigger question is this: how many suburbs in the United States of population 25,000 to 100,000 have median household incomes over $150,000? I suspect this is not a huge list. Hence, there are only 28 suburbs who meet this criteria and grew between 2018 and 2023.

But it may not take much to change the parameters to include more suburban communities on the list. For example:

  1. What if the median household income was $140,000? Is there a strong reason for leaving the cutoff at $150,000?
  2. Why limit the population to communities between 25,000 and 100,000? If the list could includ communities between 10,000 and 100,000, are there now more growing wealthy suburbs?
  3. Limiting the analysis to metropolitan areas with 1 million people reduces the number of possible regions and suburbs. If the cutoff is 1 million people in an MSA, this means a little over 50 regions are included. Lower the region’s population and you would have more suburbs that might meet the criteria.
  4. Change the list from 30 suburbs to 20 and then the last one on the list would have 5% population growth.

Thanksgiving travel to set records this year – because there are more people in the first place?

At Thanksgiving each year come the stories about how many millions of Americans are going to travel for the holiday. But is this partly because there are more people in the country? From the story first:

Photo by Oleksandr P on Pexels.com

Just as sure as the turkey will taste dry, airports and highways are expected to be jam-packed during Thanksgiving week, a holiday period likely to end in another record day for air travel in the United States…

Auto club and insurance company AAA predicts that nearly 80 million Americans will venture at least 50 miles from home between Tuesday and next Monday. Most of them will travel by car…

The Transportation Security Administration expects to screen 18.3 million people at U.S. airports during the same seven-day stretch. That would be 6% more than during the corresponding days last year but fit a pattern set throughout 2024.

The TSA predicts that 3 million people will pass through airport security checkpoints on Sunday; more than that could break the record of 3.01 million set on the Sunday after the July Fourth holiday. Tuesday and Wednesday are expected to be the next-busiest air travel days of Thanksgiving week.

What could be other possible reasons for increased travel? Some options:

  1. Cheaper prices to travel and/or more money travelers are putting toward it. Are flights cheaper this year than in the past?
  2. The timing of Thanksgiving. The article hints that it might be different this year because Thanksgiving is so late. Does this happen every time Thanksgiving is later?
  3. An increased emphasis on or interest in visiting family.

If the media is going to report that more people are traveling, how do we know it is not just because there are more people? The US Census Bureau population clock says there are more than 337 million people in the United States now and there were more than 331 million in 2020.

What happens when a place is no longer growing quickly, Florida edition

Populations and demand in housing markets can ebb and flow. What happens when a state known for growth for a while starts to lose its luster?

Photo by Del Adams on Pexels.com

Florida was one of the epicenters of the pandemic’s great migration, but while crowds of people are trying to settle into places like Orlando, Tampa, and Jacksonville, many Floridians want to dump their homes and get out.

The exodus is mainly being driven by higher housing costs, a higher cost of living, and souring attitudes toward the influx of people who moved to Florida in recent years. Those factors combined are making daily life in the state way more difficult, current and former Florida residents said.

While 730,000 people moved to Florida during 2021 and 2022, nearly half a million people left, according to US Census data.

The state, meanwhile, just lost its status as the most moved-to region this year, according to an analysis conducted by the Florida-based moving service PODS. South Florida, in particular, ranked among the regions people were most keen to move out of, the report said.

Waning enthusiasm for the state is evident in housing activity, which has fallen from its pandemic highs. The number of homes for sale in Florida has soared 42% compared to levels last year, according to Redfin.

In the United States, growth is good. A growing population is connected to an increasing status that hopefully just brings in more people and business.

But population booms do not last forever. A good number of American communities have had periods of rapid population growth, including many big cities and numerous suburbs, and then other periods of slow growth or even population loss.

From the evidence above, it sounds like Florida’s growth has slowed. It is another matter if the state starts losing residents. If that happens, dire descriptions can emerge such as it being a “failed” state.

If growth slows in Florida, what other states might take up the mantle of those with rapid growth? Can they have a sustained run of growth that brings prestige?

Proximity to population centers means warehouses for rural areas

If you live in a rural town in the United States that is close to a number of population centers, warehouses may be in your future (if they are not already):

Photo by ELEVATE on Pexels.com

Shippensburg, Pennsylvania, and nearby rural towns like it are being drastically transformed into distribution hotspots for major retailers like Amazon and Walmart – to the dismay of some longtime residents.

With its endless acres of farmland, the tiny town is seemingly the perfect location for huge warehouses – and it is at most a day’s drive away from one-third of the US population and half of Canada‘s, making it the ideal delivery truck epicenter…

P&G, which owns Charmin, Crest, Gillette and Pampers, was one of the first to do so in 2014, followed by Amazon.com, DHL, FedEx, Home Depot, Kohler, Lowe’s, Office Depot, Pepsi, SC Johnson, Staples, Target, Ulta Beauty, Unilever and UPS, among many others…

What’s happening in Shippensburg is similar to what’s already happened to California’s Inland Empire, which used to be a major center of agriculture. Now, this area of southern California is the nation’s warehouse capital, home to Amazon and Walmart facilities.

Take out a map, draw circles around major population centers, and see the places where these circles intersect. That places like Shippensburg could be so close to so many people marks it for these changes.

This could help remind people of the ongoing connections between cities and rural areas. In today’s changing world, it is not just about farming versus commercial and industrial activity; the two spaces are tied together by trade, social networks, and an awareness of each other.