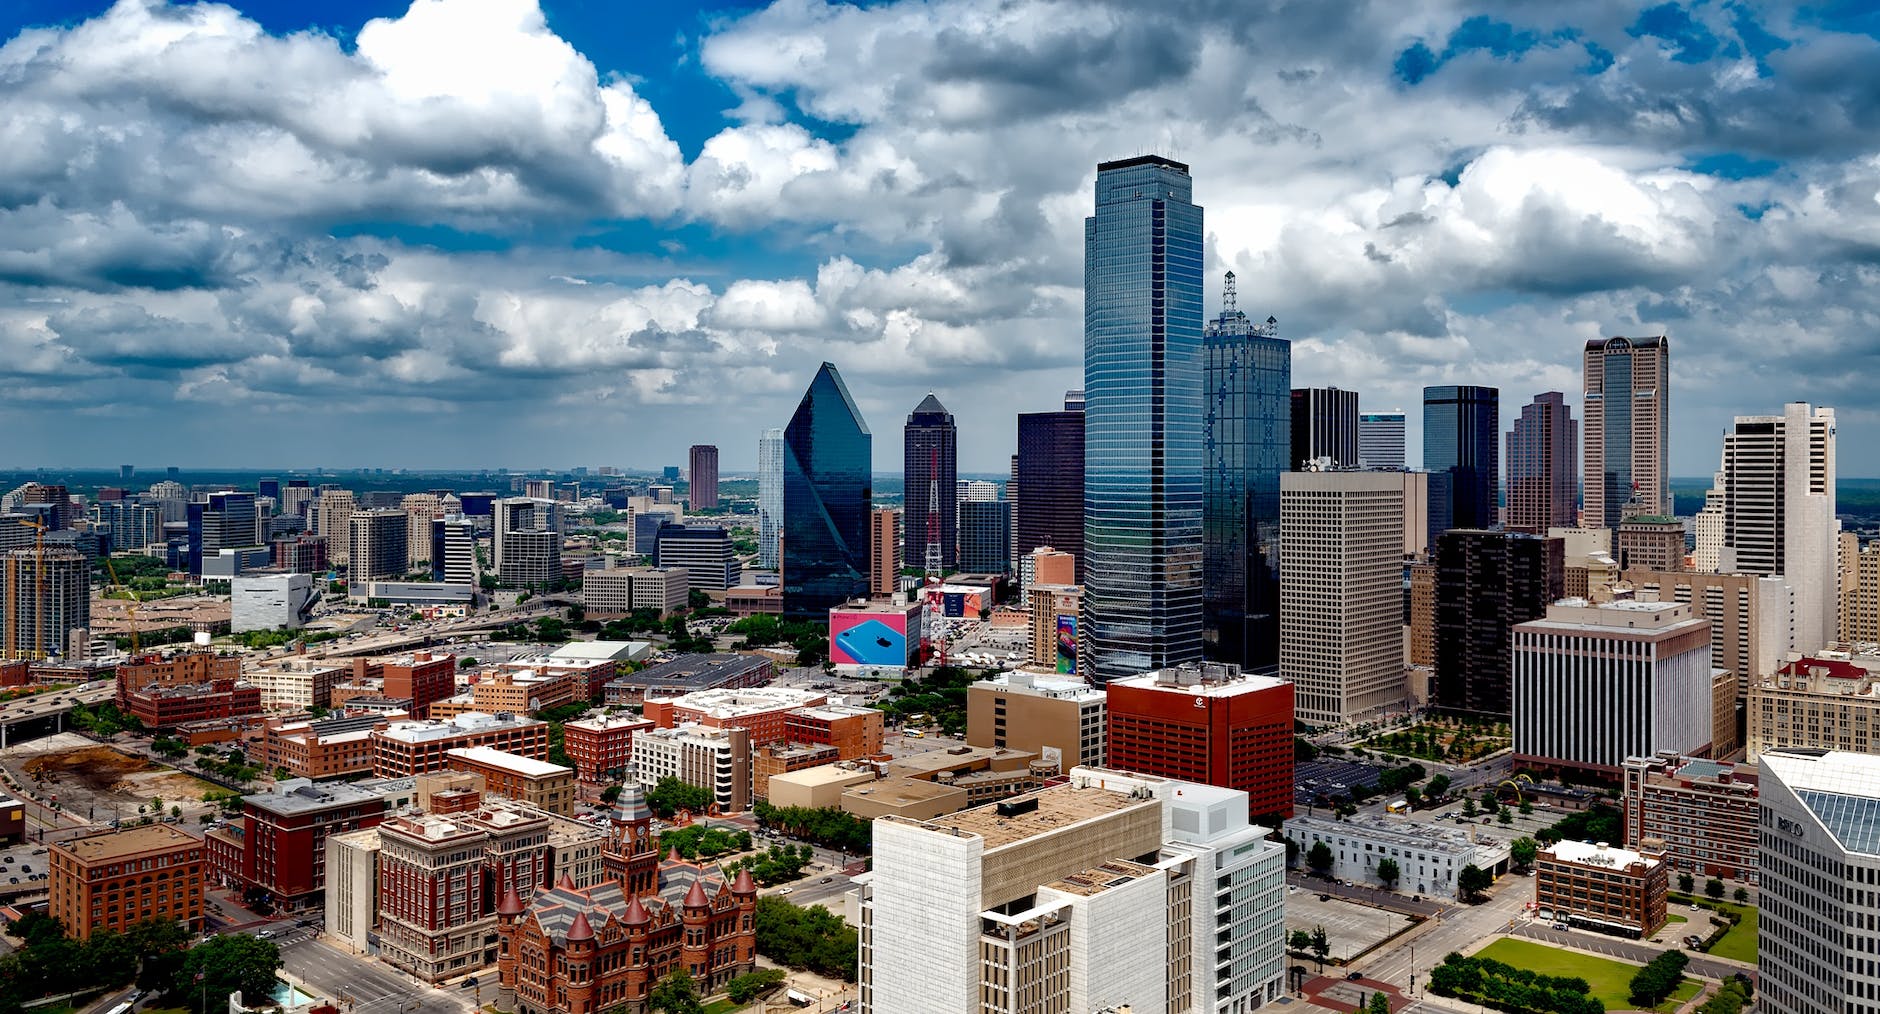
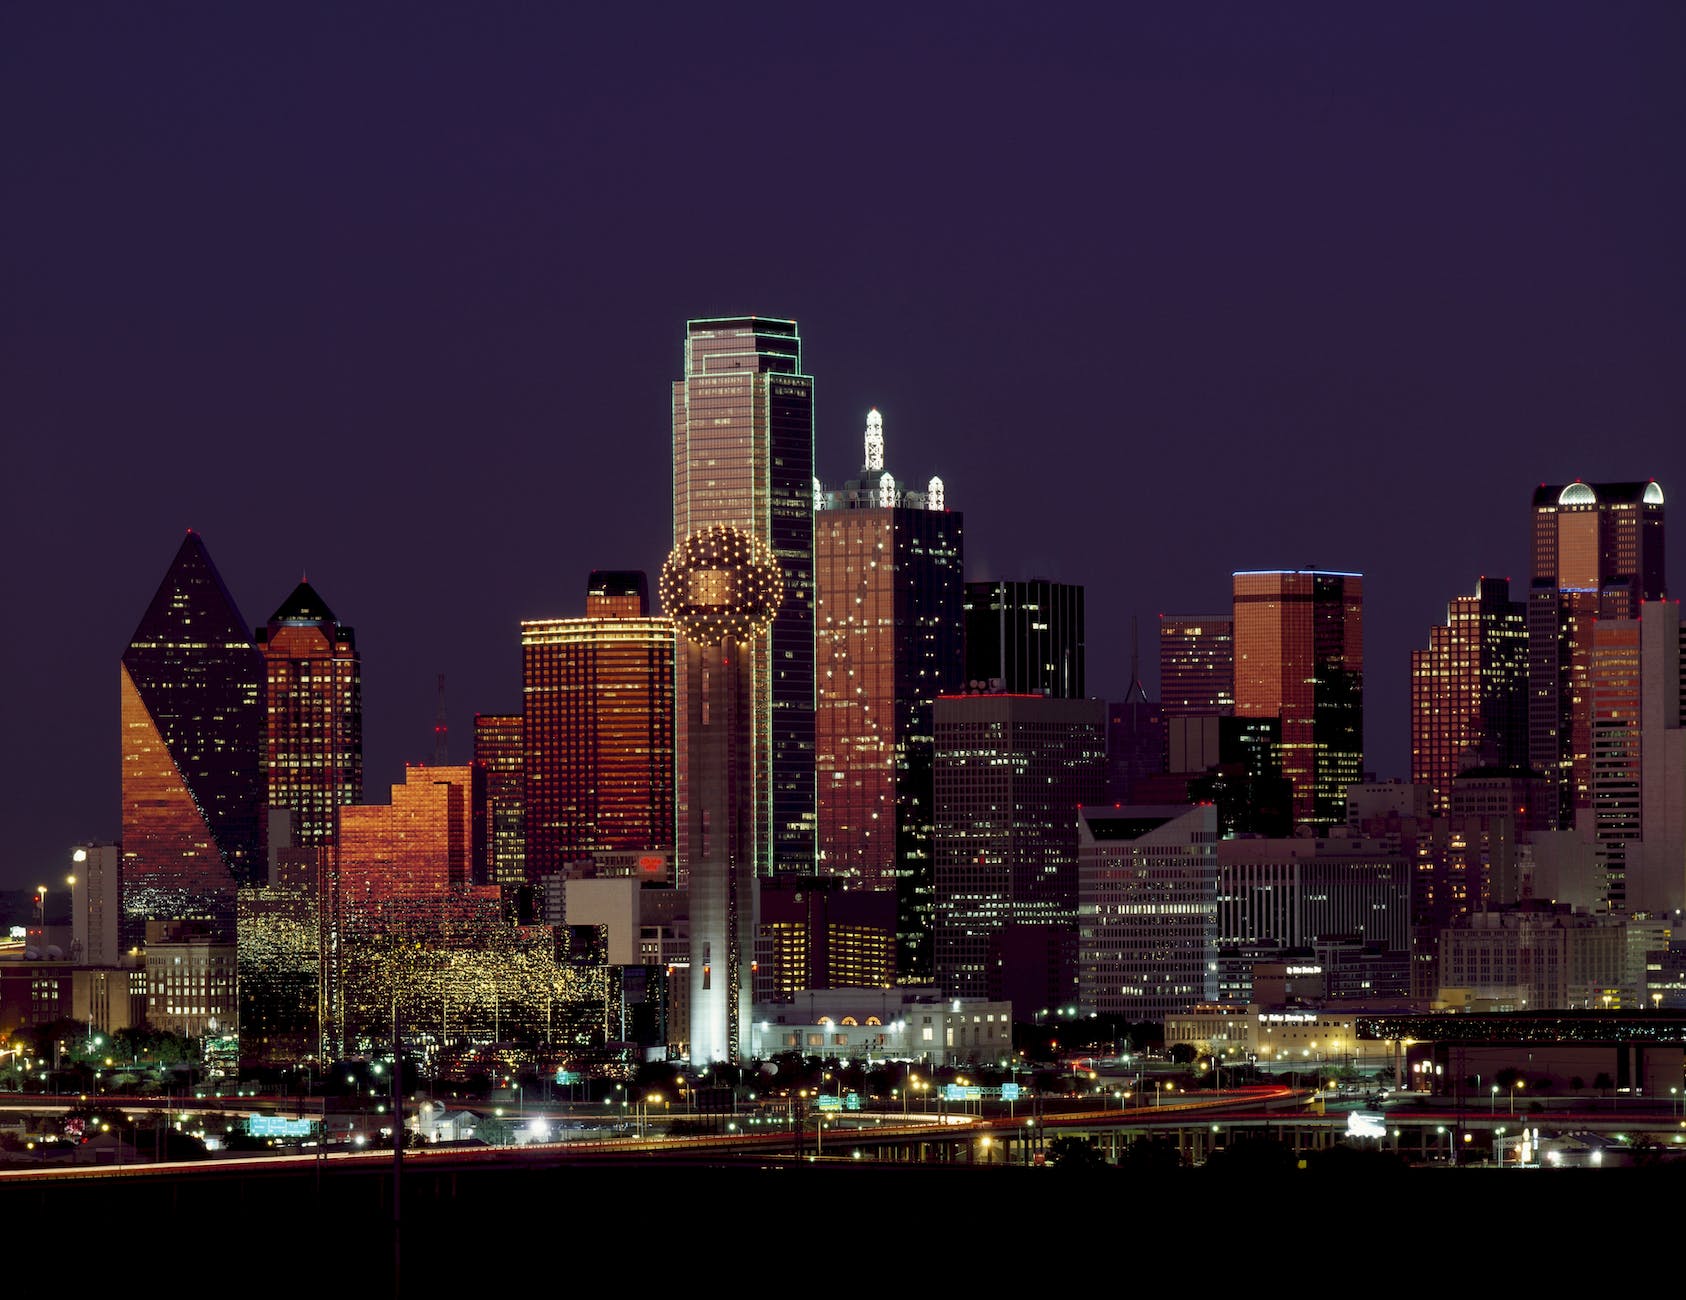
The cities college graduates are leaving, the cities college graduates are going to

A new analysis suggests college graduates are leaving some of the costliest metropolitan areas and instead moving to other metropolitan areas:

Looking at these two lists, several things stand out:

  1. Among the most expensive cities, not all have turned negative regarding college graduates moving in or out. What is different in Boston, Honolulu, Miami, San Diego and Seattle? (Some possible factors: different economic activities, the weather, relative prices, their locations within certain regions, they are not the biggest cities.)
  2. Some of the 41 other large metros are clearly more attractive than others for college graduates. This includes Atlanta, Austin, Charlotte, Dallas, Denver, Houston, Jacksonville, Las Vegas, Nashville, Phoenix, Portland, Raleigh, San Antonio, and Tampa. The Sunbelt continues to grow? Will these population changes in these cities change the conditions within these cities? Are these the current hot places to be (subject to change)?
  3. Other large metro areas might have cheaper housing and lower costs of living but they are not necessarily attracting college graduates. This includes Buffalo, Detroit, Hartford, Milwaukee, and Rochester. Is it a coincidence that these are Rust Belt metropolitan regions?

Generally, cities and regions want college graduates who can add to the population and the human capital available. But, the sorting of the college graduates across locations could have profound consequences.

What does it mean that India’s population will pass China’s population?

India will soon have more people than China. What does that mean?

Photo by Still Pixels on Pexels.com

The United Nations has said India’s population is projected to surpass China’s sometime this year. Many demographers estimate it could happen this month, if it hasn’t already. India’s population is expected to reach 1.429 billion by the end of the year, according to the U.N. China will fall to second place, with 1.426 billion people. Both dwarf the U.S. at a projected 340 million.

India’s rising population means it’s likely to keep its economy growing, buy more of the world’s goods and play a bigger role in global affairs, even as it grapples with poverty and a lack of jobs. 

China’s demographic headwinds will make it harder for the country to achieve its economic ambitions, or to supplant the U.S. as the world’s biggest economy, despite its rising wealth and military power…

India’s population is expected to keep growing for the next four decades, peaking at nearly 1.7 billion in 2063. China’s population, which declined last year for the first time since famines in the 1960s, according to government data, is projected to shrink rapidly. By the start of the next century, India’s population is expected to be double that of China’s.    

Numbers are just numbers; we give them significance. Is this just about large numbers and their ability to impress people? Here, two countries have nearly a billion and half people each. That is a lot of people and far ahead of the next most populous countries.

It could also be about being the country with the most people. This has been China for a while but will soon be India. Does having the most people provide an exalted status?

Or, is it about economic activity and growth. A large and growing population means economic opportunities internally and externally.

Yet, it could be more about growth than absolute numbers. Yes, it is important to be first in population but this is also about expected growth for India and a declining population in China. Not only will India be #1 in residents, it could be far ahead of China in population soon.

What this all adds up to is hard to say. India will be the most populous nation, China will be second. The population arrows will be headed in different directions. Does it mean a significant change in status and economic status? The number of people in each country may just play a role in this.

What will be the first “city of the future”?

Multiple efforts are underway around the globe to construct new kinds of cities. Here is an overview of some of this work:

Photo by Pixabay on Pexels.com

Telosa is set to be built on 150,000 acres in either Nevada, Utah or Arizona, and 50,000 “diverse” people will call it home by 2030, according to newly released details from Lore — a serial entrepreneur who sold Jet.com to Walmart for $3.3 billion and the parent company of Diapers.com to Amazon for $545 million.

“We’re not just building a new city — this is a new model for society,” Lore said at a Telosa “town hall meeting” in July, adding that he wants his new city to be “sustainable and equitable to all.”

It’ll be governed by a principle he calls “equitism,” which seems to be a mashup of democracy, capitalism and socialism…

Floating City in the Maldives is envisioned as a large cluster of hexagonal structures that rise and fall with the sea, with room for up to 20,000 people. It’s set to be completed in 2027

Toyota Woven City is a company town being built in the foothills of Japan’s Mount Fuji. The proposal calls for a 2,000-person city where Toyota “will test autonomous vehicles, smart technology and robot-assisted living,” per CNN.

Masdar City in Abu Dhabi is a “master-planned eco-complex designed to show off the UAE’s commitment to sustainability,” Bloomberg has reported.

Net City in Shenzhen, China, is another company town being built by tech giant Tencent. It’ll be a Monaco-size metropolis for 80,000 workers, CNN reports.

Several other projects are briefly mentioned in the article. Across all of these proposed communities, there are several patterns:

  1. Created by the ultra-wealthy or corporations.
  2. Incorporating sustainability or new technology.
  3. A limited population.

It strikes me that we now have a good sense of what megacities are around the world: they have a certain population and share common traits regarding land use, economics, and social life. Such cities are relatively new in human history but now they are common. So then what exactly needs to be different for a new community to be a futuristic city? A different aesthetic? No cars or limited cars? Much greener? Smaller in scale? Different social arrangements?

Does a “medium sized suburb” have 20,000 residents?

I recently saw a headline comparing a group of people to the population size of a suburb:

Photo by Ingo Joseph on Pexels.com

Nearly 20,000 Cook County residents holding revoked FOID cards — enough to populate a medium-sized suburb

More population comparisons from later in the story:

Arthur Jackson, first deputy chief of police for the Cook County Sheriff’s Police Department, told legislators over the years, 33,000 Cook County residents’ firearm owner’s identification cards have been revoked because of violent felony convictions, domestic violence charges or serious mental health issues.

That’s more than the entire population of Highland Park in Lake County.

Of that total, “nearly 20,000” have not turned in their cards — more than the population of north suburban Deerfield.

“Medium” is between “small” and “large.” The smallest suburbs can be just a few hundred or a few thousand people while the largest suburbs can have several hundred thousand residents. Is nearly 20,000 in the middle?

The comparisons to specific suburbs might be more helpful, particularly if people know something about Highland Park or Deerfield. They can picture these communities and then make the connection to the number of people with revoked FOID cards.

Other comparisons that might be better: the number of people in a basketball arena, the number of students at a college, the number of people at a concert.

I am not sure that a “medium-sized suburb” is clear enough to help people understand the number at question here.

The US county with the longest life expectancy – and a big error margin

A recent ranking of US counties by life expectancy at birth now found Aleutians East Borough at the top of the list:

This is one of three counties with a life expectancy of “100+.” Out of these three, it is also the one with the largest error margin. If I am interpreting this correctly, the list compilers are 95% confident that the life expectancy of this county is between 67.9 and 100+.

This is most likely due to the relatively small number of people in the county. This is not uncommon in these rankings: of the top 16 counties in life expectancy, the highest population is over 55,000 and several counties have fewer people than the one ranking #1. When there are fewer cases (residents, for this analysis) to consider, it is harder to be confident in the calculated life expectancy. My guess is that this county had the highest expected life expectancy in the statistical model so even with the large confidence interval it ended up at the top of the list.

With fewer people in a number of these counties, the year-to-year predictions could shift more given conditions. Does this mean the rankings should be disregarded? Not necessarily but the confidence interval does provide insight into how the life spans of a small number of residents can change these rankings.

Illinois lost population in the 2020 Census and then it gained population after estimates of an undercount

The Census Bureau reported last week on states where populations were likely undercounted or overcounted. Illinois fell into the first camp:

Photo by Skylar Kang on Pexels.com

The U.S. Census Bureau originally found that Illinois lost about 18,000 people over the prior decade, which was the first time numbers showed Illinois’ overall population had declined since it joined the union in 1818. But after a follow-up survey — something that happens after each once-a-decade head count of the U.S. population — it discovered the state’s population figures had likely been undercounted…

“These latest numbers from the U.S. Census Bureau show that Illinois is now a state on the rise with a growing population,” Democratic Gov. J.B. Pritzker said in a statement. “ … I look forward to celebrating this development with all Illinoisans, including those who routinely bad-mouth our state.”…

The estimate that Illinois’ population was undercounted by 1.97%, or about 250,000, was the midpoint provided in the survey. The population could have been undercounted by as much as 440,000 people, or 3.43%, or as little as 65,000 people, or 0.51%, the survey showed.

I am interested in methodology and how small numbers can affect something seemingly simple like the number of people living in a state.

The Census Bureau puts much effort into getting the count right. This requires years of efforts leading up to the dicennial census, a lot of work in that year, and many resources put into all of it.

Losing 18,000 people over a ten year stretch is a small blip in a state that has over 12,000,000 residents. Similarly, gaining 250,000 people – the midpoint of the undercount estimate – is just a few percent of the total population. Either way, the Illinois population did not change all that much. It stayed relatively the same.

The real issue for Illinois and its leaders are the perceptions about population in Illinois and how Illinois compares to other states. Many agree: populations of state and communities should be growing for them to be deemed healthy. Population growth is good. In contrast, losing people is a sign of distress.

Similarly, even if Illinois grew by 250,000 people or lost 18,000 people, it matters how this compares to other places. Is Illinois more like Rust Belt communities and states or is it more like Sunbelt communities and states? Can Illinois be a shining light for population growth in the Upper Midwest? An so on.

It does not appear the overcount/undercount estimates will become official population figures so this story will likely continue in Illinois with subsequent Census estimates and political claims about population.

Populations – national or local – can grow or decline through births, deaths, and immigration

While the focus here is on the United States as a whole, this is also worth considering at the community level:

Photo by Skitterphoto on Pexels.com

A country grows or shrinks in three ways: immigration, deaths, and births. America’s declining fertility rate often gets the headline treatment. Journalists are obsessed with the question of why Americans aren’t having more babies. And because I’m a journalist, be assured that we’ll do the baby thing in a moment. But it’s the other two factors—death and immigration—that are overwhelmingly responsible for the collapse in U.S. population growth…

As recently as 2016, net immigration to the United States exceeded 1 million people. But immigration has since collapsed by about 75 percent, falling below 250,000 last year. Immigration fell by more than half in almost all of the hot spots for foreign-born migrants, including New York, Miami, Los Angeles, and San Francisco…

The implications of permanently slumped population growth are wide-ranging. Shrinking populations produce stagnant economies. Stagnant economies create wonky cultural knock-on effects, like a zero-sum mentality that ironically makes it harder to pursue pro-growth policies. (For example, people in slow-growth regions might be fearful of immigrants because they seem to represent a threat to scarce business opportunities, even though immigration represents these places’ best chance to grow their population and economy.) The sector-by-sector implications of declining population would also get very wonky very fast. Higher education is already fighting for its life in the age of remote school and rising tuition costs. Imagine what happens if, following the historically large Millennial cohort, every subsequent U.S. generation gets smaller and smaller until the end of time, slowly starving many colleges of the revenue they’ve come to expect.

Even if you’re of the dubious opinion that the U.S. would be better off with a smaller population, American demographic policy is bad for Americans who are alive right now. We are a nation where families have fewer kids than they want; where Americans die of violence, drugs, accidents, and illness at higher rates than similarly rich countries; and where geniuses who want to found new job-creating companies are forced to do so in other countries, which get all the benefits of higher productivity, higher tax revenue, and better jobs.

This matters for communities and cities in at least a few ways:

  1. The “growth is good” model in the United States assumes continued population growth. This is good for status as well as for other things (see #2).
  2. When populations are growing, the incoming revenues help pay for existing infrastructure and services as well as suggest money will be there in the future. In contrast, stagnant or declining populations can require cuts or reductions.
  3. The role of immigration cannot be understated and it affects population as well as demographics and local economics. For example, Chicago would have likely had more population loss over recent decades without immigrants coming to the city.

It will be particularly interesting to see what happens if more major population centers experience relatively little or no population growth while a few continue to grow rapidly. Does this change the balance of power and status among places?

Why people do not flock to the American cities that keep showing up in the most affordable places to live

I recently saw another list of the most and least affordable metropolitan areas in the United States with a key metric of how many families in the region could purchase a home at the median price. Here are the five most affordable places:

Photo by Ketut Subiyanto on Pexels.com

Home prices and incomes vary widely, and there are oases of affordability, mainly in the Rust Belt and Midwest. The top five most affordable places among metro areas with population of 500,000 or more:

Lansing, Michigan: As a result of modest home prices, 90.6 percent of all new and existing homes sold in the fall months were affordable to families earning the area’s median income of $79,100. The median home price was $155,000 in the fourth quarter of 2021, the builders’ index says.

Scranton-Wilkes Barre-Hazleton, Pennsylvania: Wages here are below national levels, but so are home prices — the median sale price was $150,000 in the fourth quarter. As a result of rock-bottom prices, 88.5 percent of all new and existing homes sold in October, November and December of 2021 were affordable to families earning the area’s median income of $70,600.

Pittsburgh: This metro area has a median family income of $84,800 and a median home price of just $166,000. As a result, 88.4 percent of homes were affordable for typical earners.

Indianapolis. This metro area has a median family income of $81,600 and a median home price of $215,000. As a result, 87.6 percent of homes were affordable for typical earners.

Akron, Ohio: With a median family income of $83,300 and a median home price of $165,000, fully 86.5 percent of homes were in reach of median-income families in the state capital.

Two features quickly stand out: the homes in these regions really are cheap (particularly when compared to local earnings) and they are all in the Midwest/Rust Belt.

Still, I have seen some version of this list many times now and I am not sure what to make of them. Why aren’t people moving to these locations?

The most obvious answers to me: it is not necessarily easy to move and these cities are perceived to have a lack of opportunities (economic, cultural, housing, etc.). American geographic mobility as a whole is down but do people actually move just for cheaper housing? What this list does is highlights that median income families can access median level housing in these five places. Get a decent job and owning a house is possible.

There are other possible answers that get more complicated:

  1. People just do not think of the Midwest/Rust Belt when thinking of places to live. Lack of opportunities, the weather, the middle of the country, a Midwestern blah-ness, etc.
  2. It is not just about a lack of opportunity; these are places seen as on the decline. Even if they are cheaper, who wants to live in a place that has already seen its best days when “growth is good” is a key marker of communities?
  3. These communities are lacking incentive campaigns to try to attract new residents.
  4. These communities may not want too many people to move in because it could drive up prices and bring in outsiders. (Yet, growth is good and many declining communities would do a lot to become a destination again.)

In sum: some American metropolitan areas are much cheaper than others, they have common characteristics, and there are a number of compelling reasons why people do not move to the places with cheaper housing.

The relative concept of “the big city”

The United States has big cities of various sizes. For example, the Wikipedia list of the largest cities in the United States ranges from New York City to #326 on the list, Roanoke, Virginia, at just over 100,000 residents. By important measures, whether population size, density, or land size, some places are definitely bigger than others.

Photo by Cameron Casey on Pexels.com

But, a trip this week to Springfield, Illinois reminded me that these absolute measures obscure how different big cities function within their own regions or geographic areas. Take Illinois. The biggest city by far is Chicago and the majority of Illinois residents live within that metropolitan region. Yet, within Illinois there are numerous smaller big cities that anchor sizable areas as well as the big city of St. Louis just over the Mississippi River. If you are in Quincy, Illinois, with roughly 40,000 residents, Springfield at over 114,000 residents might be the big city over an hour away. Chicago is even further away both geographically, five hours by car or train, and culturally. Regional political, economic, cultural, infrastructure, and health systems revolve around these smaller big cities which then have links to the less common truly big cities.

This even happens within the Chicago area. Yes, the truly big city is close and can even be seen from different high points 25-30 miles away. But, in daily activity, many suburbanites do not travel to the big city. They may travel to a different suburb for work as jobs can be concentrated in suburban job centers,e they attend religious services or lessons for their kids in yet other suburbs, and they look for restaurants in entertainment in even more suburbs. The suburban lifestyle is dominant, even thought a world-leading global city is nearby.

Put these different experiences together and “the big city” can mean different things in different contexts. Is it the regional center an hour away, the truly large city with a major international airport several hours away, the sizable suburb nearby that offers some different options, the tourist magnet that many people visit, or the big city as it is depicted on television and movie screens?

Reasons for suburban legislators leading the Illinois Democrats

As American political divides currently sit in the suburbs, the tension between Chicago Democrats and suburban Democrats in Illinois is interesting to consider:

Photo by Kelly Lacy on Pexels.com

In adding suburbia to the Democratic base, it turned out, Madigan also created a party that would no longer tolerate his Chicago ward boss style of leadership.

“Suburbanites tend to be less enamored of machine politics,” said Christopher Z. Mooney, a professor of political science at the University of Illinois-Chicago. “Machine politics is about one thing: getting jobs. Suburban voters tend to be more concerned about corruption. They’re a little better off,” and thus don’t need the government jobs political bosses can dole out…

While many suburban representatives had benefited from Madigan’s operation, the ComEd scandal marked the moment that “a limit had been reached,” Mooney said. “They felt that his usefulness was over. The fact that they were from the suburbs allowed them to have some cover. Madigan’s political tentacles are more effective in the city of Chicago or Cook County.”…

Suburbanites haven’t just changed the way politics is conducted within the Democratic Party, they’ve also made certain issues more important to the party. Abortion, for instance. In the 1980s, the Catholic Madigan declared himself “100% pro-life.” In 2019, he supported the Reproductive Health Act, which ensured that abortion will be legal in Illinois if Roe v. Wade is overturned, and declares that a “fetus does not have independent rights under the laws of this state.”

The explanations here suggest the changes in suburbs have had significant consequences for politics. As noted above, corruption turns off suburban voters – who often like the idea of more virtuous smaller local government – and there are more pro-choice suburban voters.

I could imagine several other factors involving suburbia that have influenced this change:

  1. The increasing suburban population compared to the population of Chicago. As a proportion of Illinois residents, there are more suburbanites than in the past. This does not necessarily guarantee changes toward what suburbanites want but it could be a factor.
  2. The suburbs have changed in demographic composition. There are now different kinds of suburban residents, including more racial and ethnic minorities and more lower-income residents. The whiter and wealthier suburbs still exist in places but so does more complex suburbia. The suburban voters today are not just more educated whites.
  3. While the comparison above is between Chicago style politics and suburban politics, I wonder how suburbanites view the big city more broadly as compared to the past. Are more suburbanites interested in life in denser communities with more cultural opportunities (even if they are in the suburbs)? How essential is Chicago to the region and state compared to all of the activity – business, cultural, civically – in the suburbs?