
HomeAdvisor looked at tweets about tiny houses and examined geographic patterns:
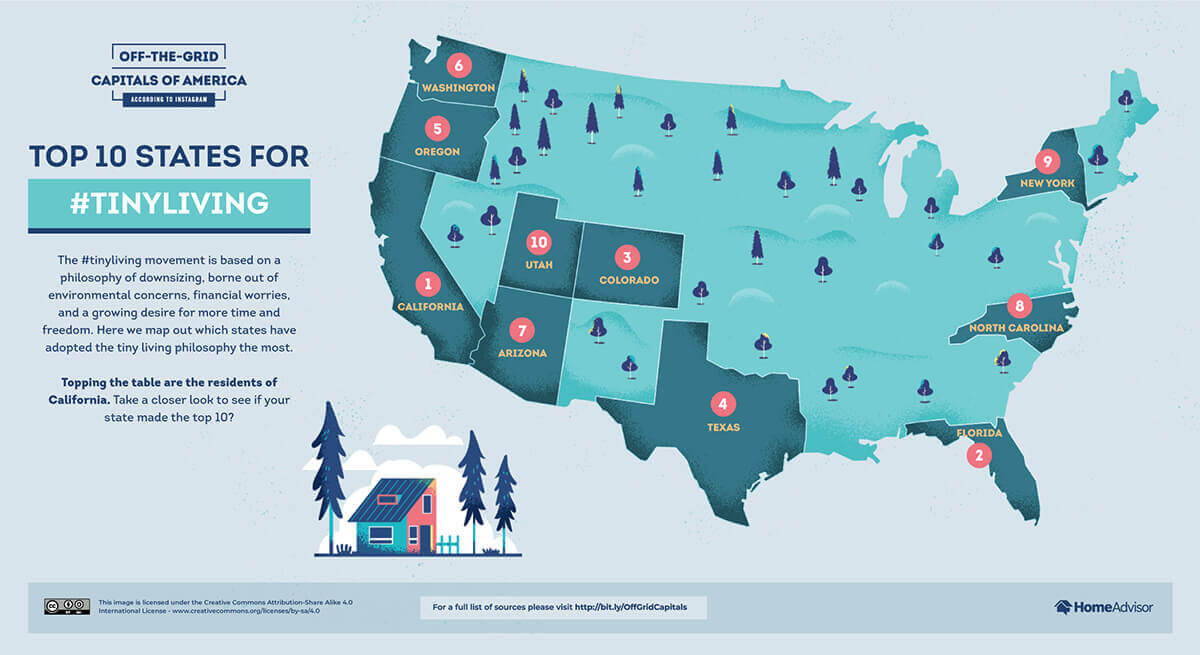
The best states for #tinyliving living – https://www.homeadvisor.com/r/off-the-grid-capitals/
The methodology:
To create these visualizations, we collected data by “scraping” it. Scraping is a technique that gathers large amounts of data from websites. In this case, we wrote a custom script in Python to get the data for each hashtag. The script collected information including the number of likes, number of comments, location, etc. for posts with each of the three lifestyle hashtags. The python script also collects data that human users can‘t see, like specific location information about where the post was published from.
We didn’t include posts without location information. We also didn’t include posts outside of the United States. We then standardized the city and state data. Then, we grouped the posts by city and by state, tallying the number of posts for each hashtag. This gave us our top locations.
And more details on the state and city level data:
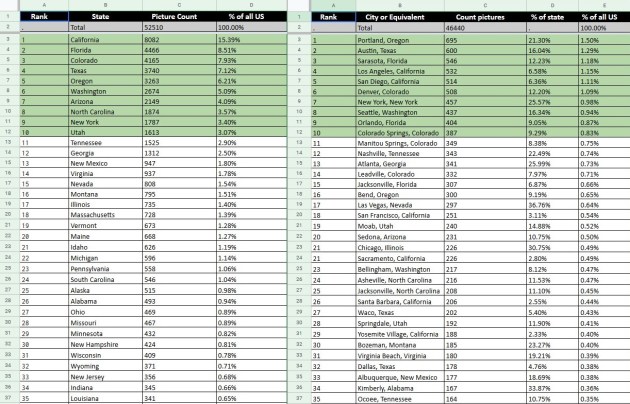
On one hand, this is interesting data. California, in particular, stands out though this may not be that surprising given its size, good weather, and high housing prices. The rest of the top ten seem to match similar characteristics including scenic areas and good weather (New York and possibly Colorado winters excluded). The city level data compared to the state numbers provides some insights – major cities can account for a large percentage of tweets for a whole state – but there are not many cases in any particular city.
On the other hand, it is hard to know what exactly this Twitter data means. There are multiple issues: how many Americans are on Twitter or are active on Twitter and does this overlap with those who like and have tiny houses? Some of the tweets about tiny houses did not have location data – is the data missing at random or does it intersect with the patterns above? Does the #tinyliving hashtag capture the tiny house movement or a part of it?
Because of these issues, I still do not have a better idea of whether the tiny house movement is sizable or not. Having some denominator would help; of the California tweets, how does this compare to the number of single-family homes or apartments in the state? Portland, Oregon leads the way with 695 cases but over 650,000 people live in the city. How do these tweet numbers compare to people tweeting about HGTV shows or single-family homes?
There is a lot that can be done here and making use of data publicly available on websites and social media is smart. Figuring out which questions can be asked and answered with such data and then collecting good data is a challenging and possibly rewarding task.

Pingback: Wealthier Americans have a larger carbon footprint in part due to larger homes | Legally Sociable
Pingback: Flipping houses stats – up then Great Recession then up then down again – and questions | Legally Sociable
Pingback: Steps for growing the tiny house movement in 2021 | Legally Sociable