
An infographic in Christianity Today highlights how many polling places are in churches:
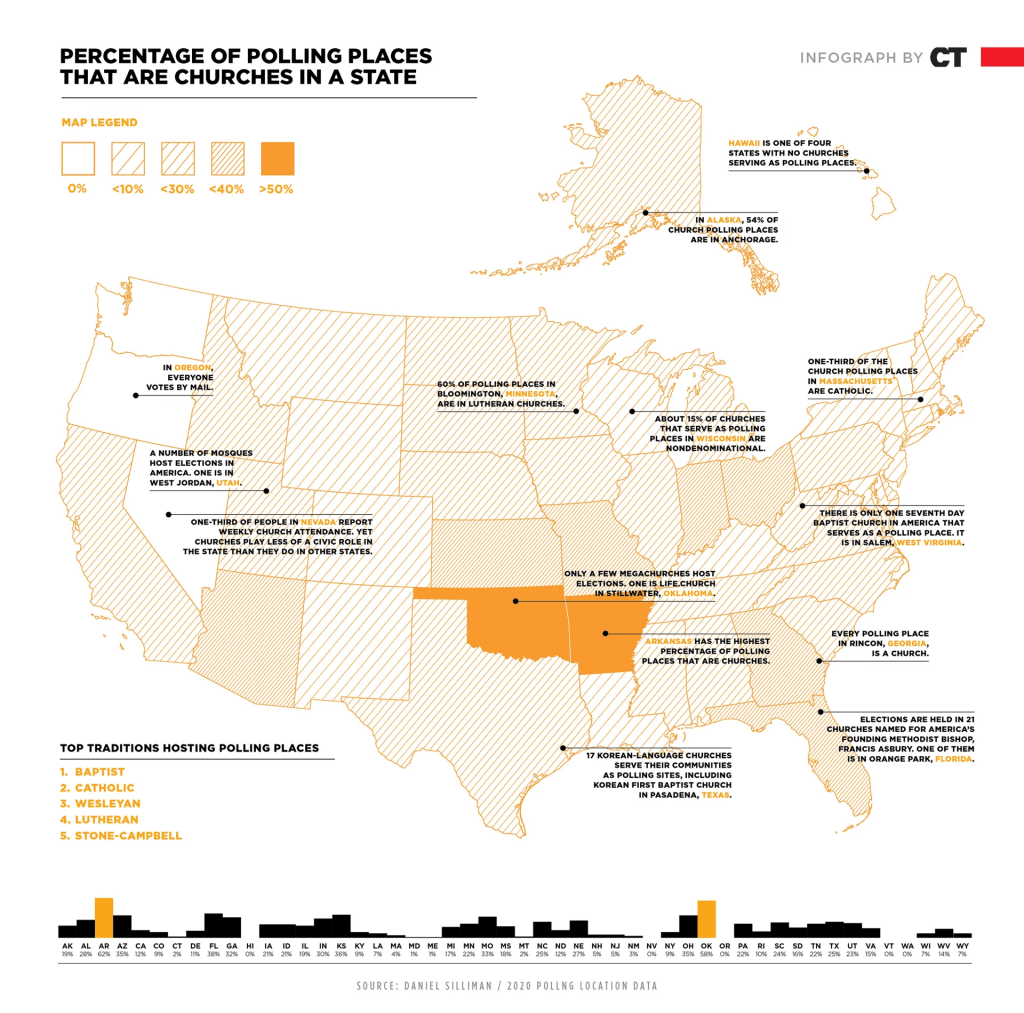
If I am reading this correctly, here are two patterns:
- The percent of polling places that are churches can differ quite a bit from state to state. Generally, some of the Northwest and Northeast are less likely to have churches as polling place. The highest percentages are in more “heartland” states with some interesting exceptions (Arizona, Florida).
- Which religious groups host the most polling places can differ as well. It would be interesting to see more fine-grained data/ do these patterns of particular traditions hold up across states or is it because certain states have higher concentrations of certain traditions?
I imagine there might be all sorts of additional factors to consider when examining this.
Given the current political sentiments regarding the role or involvement of religious groups in politics, do these figures go up or down significantly in the coming years? And among which groups and locations?
