I recently read news about a developer wanting to build duplexes in a nearby suburb. I soon saw reactions on social media platforms to the proposal. One response suggested the land should be protected green space while another response said what the community really needed was affordable housing.
These are not unusual reactions from suburbanites opposed to housing proposals in their community. What is different compared to reactions in the past is the form the reactions now take: quick responses online that can then reach other community members (and broader audiences). How different is this opposition compared to 50 years ago?
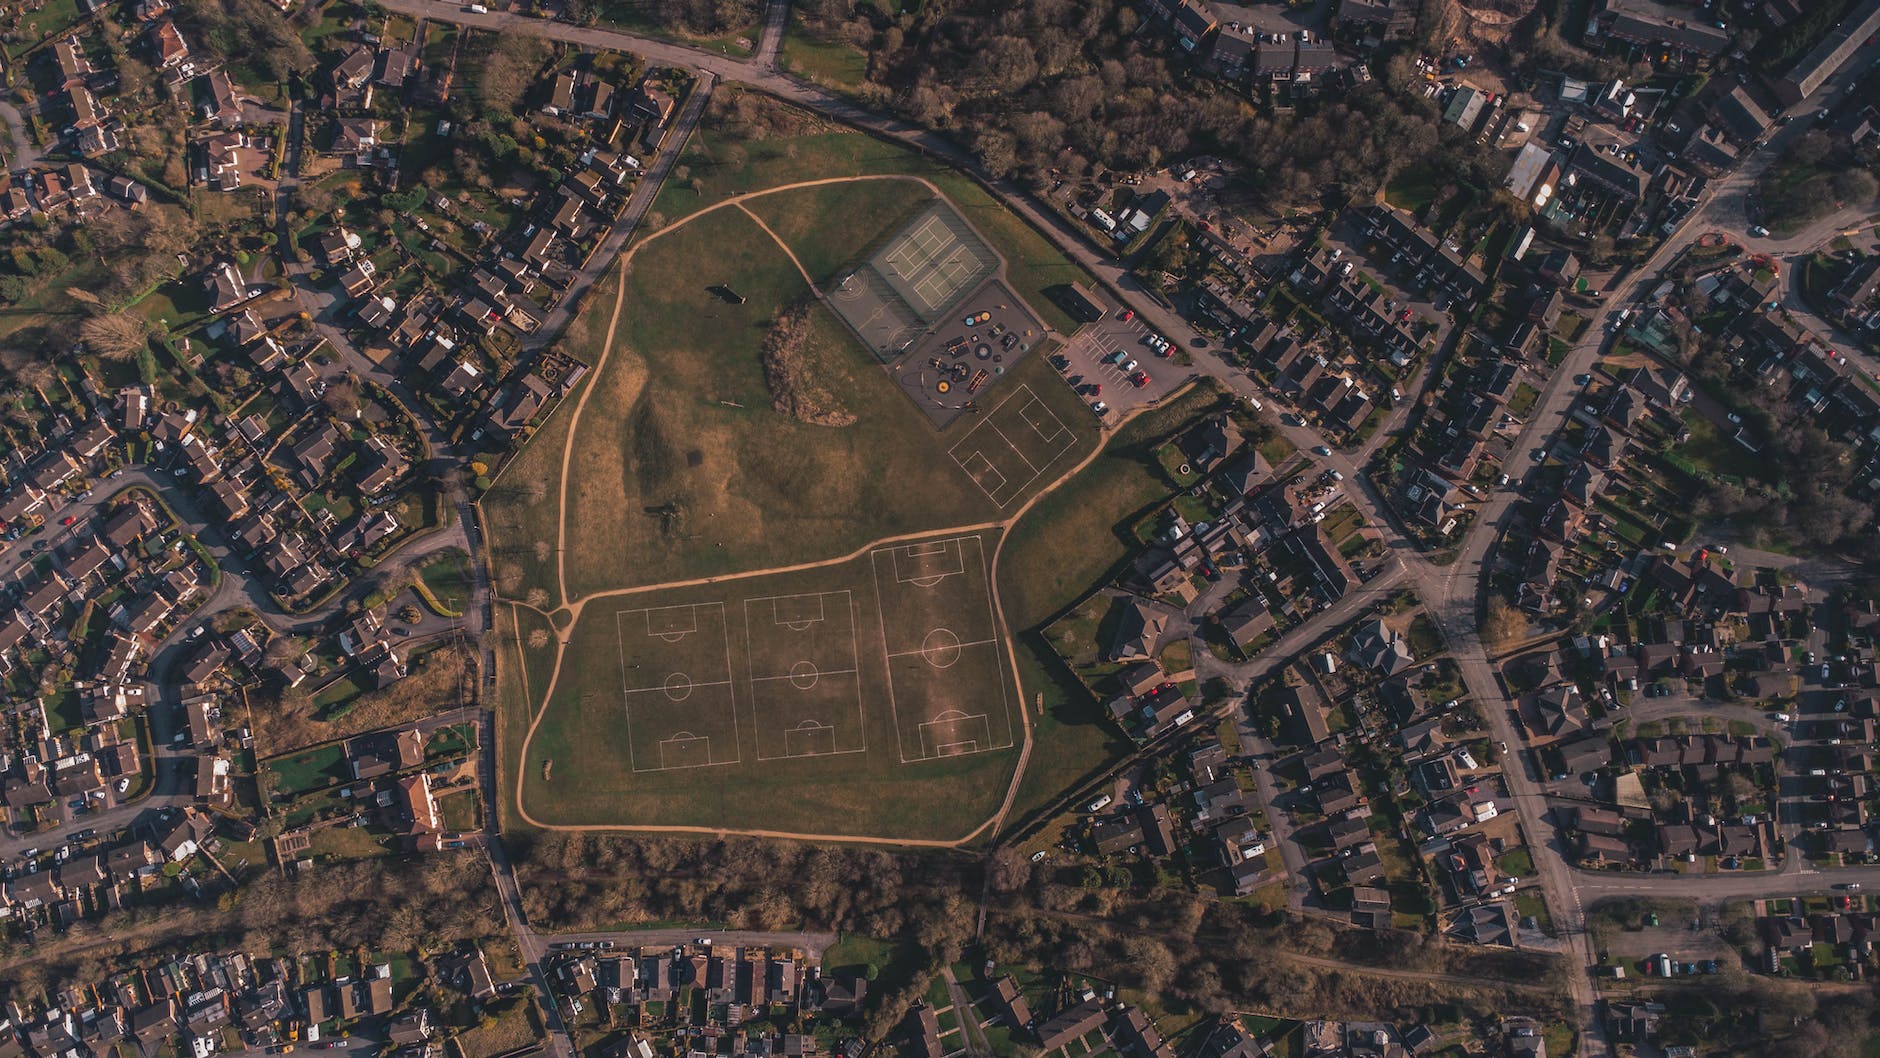
My own research on suburban development suggests suburbanites have opposed new housing and other kinds of development near them for decades. This occurred even as their community was growing rapidly and some of them had been part of that growth in recent years. Residents made arguments about the character of the community, traffic, water management, green or open space, local services, threats to property values, and who might move in.
But without online platforms to share their opinions, how did these residents go about voicing their concerns? One regular forum not used much today involved writing letters to the editor. In local newspapers, residents shared their argument in relatively few words. These discussions could go then back and forth multiple times as supporters and opponents of particular plans wrote in.
Presumably suburbanites talked to neighbors and others in the community. Social scientists have argued the social fabric of the United States looked different decades ago as more Americans were involved in local organizations. Americans may have had more close friends. These relationships would provide space to discuss local issues.
Local petitions could demonstrate the opinions of residents. People would collect signatures and present them to local officials. Decades ago, this would have involved going door to door or being in public spaces to get names on paper. The process looks a little different today through change.org or similar venues.
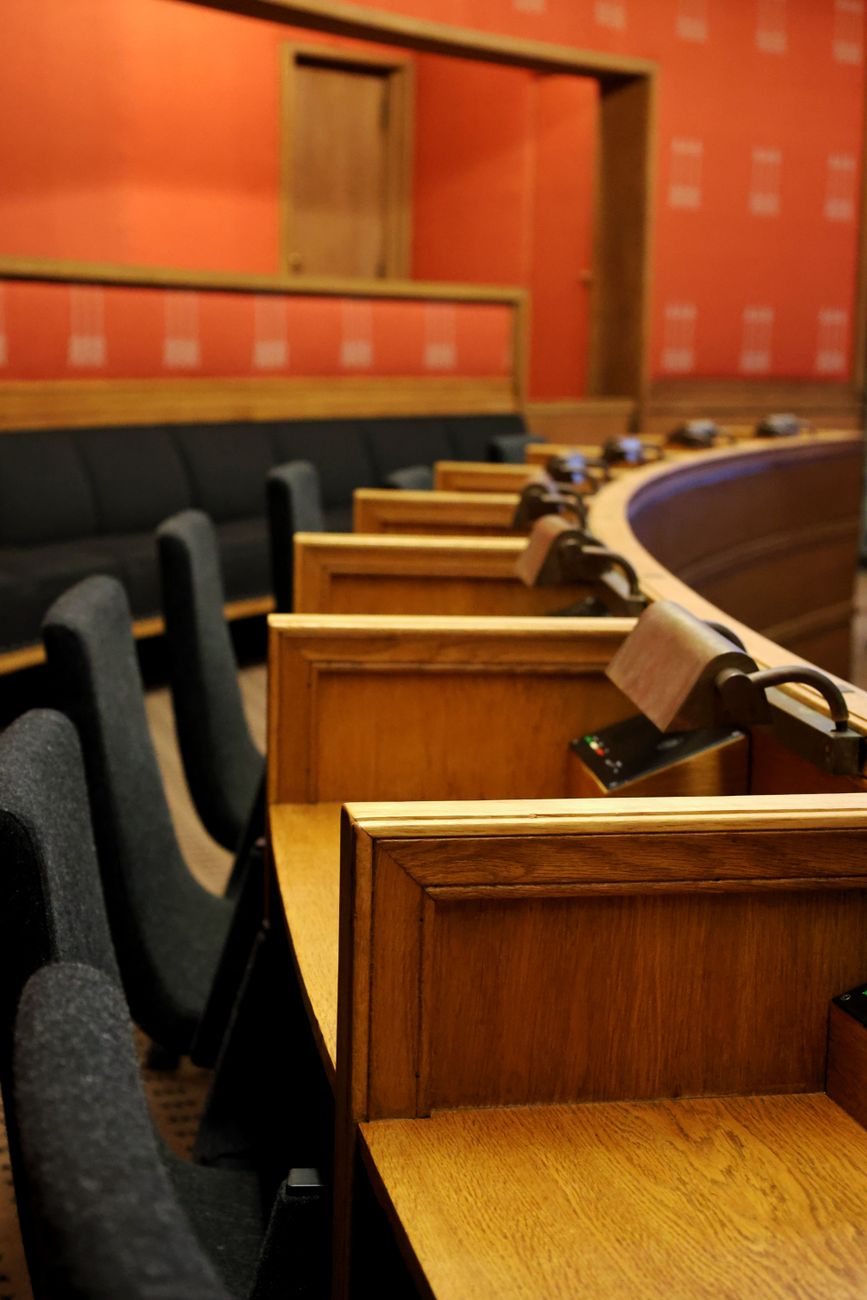
At the same time, the process by which these proposals move forward looks similar to fifty years ago. Developers talk with municipal leaders and staff. The plans of developers are vetted by zoning boards or plan commissions who then make a recommendation to a city council or village board. Residents and others have a chance to share their opinion in public in public hearings along the way or in some meetings when leaders and developers are discussing plans. There are often months, sometimes years, for conversation and deliberations to take place.
Do the loud voices online either for or against a proposal attract more attention than efforts of residents in the past? Either way, the majority of residents in a community do not publicly voice an opinion. They might vote a certain way based on such decisions or maybe even move to a different community based on what they think is happening. And these actions can be consequential; decisions about development helps shape a community for decades.