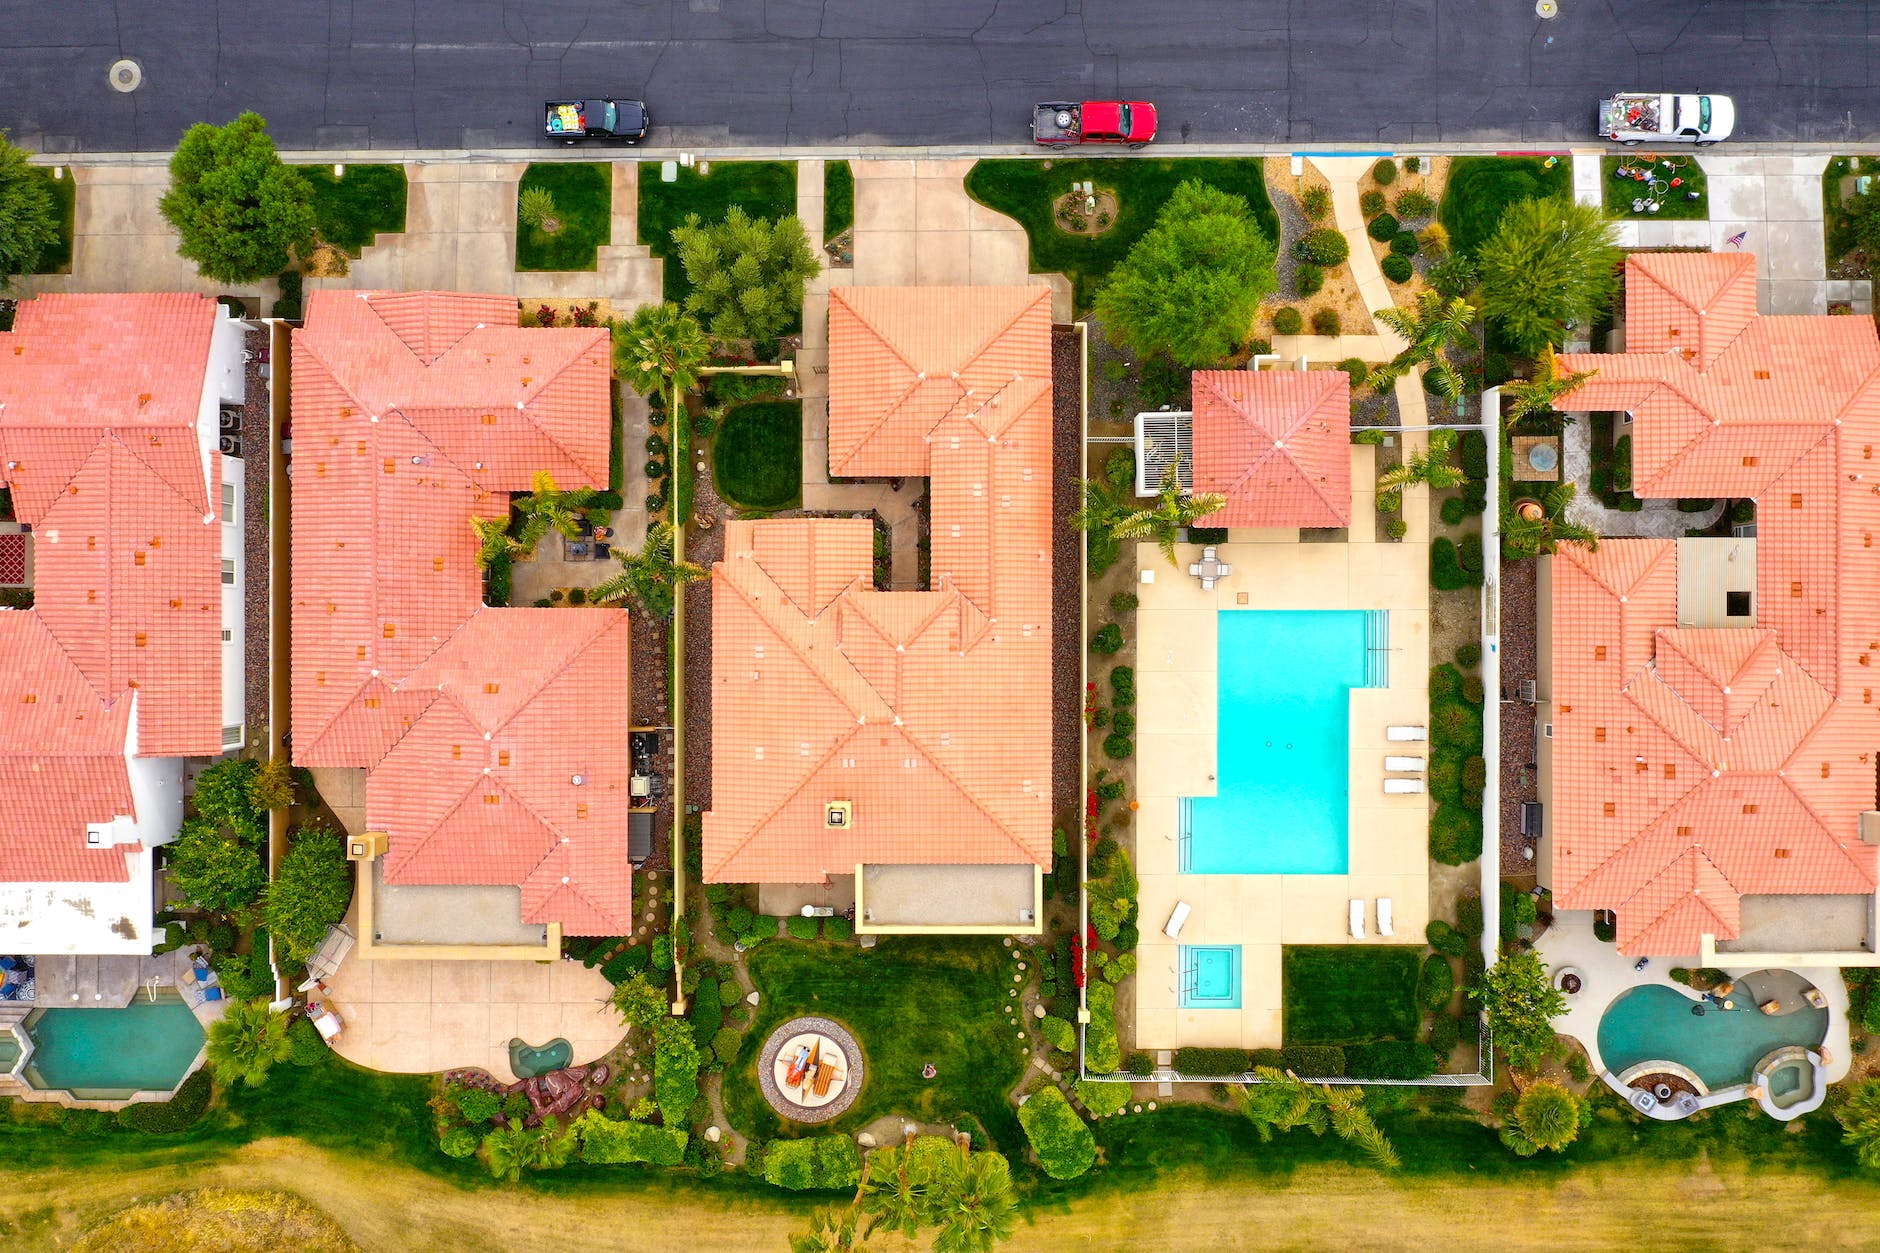
Atherton is a small suburb – under 7,000 residents – with a median household income of over $250,000. In question is a California effort to increase affordable housing.
Are there any or many communities in the United States where the wealthy do not pursue NIMBY policies?
Could it be different in places where wealthier residents can escape by living high up in the air? I am thinking of residences like the pencil skyscrapers just south of Central Park or the new condos south of downtown LA.
Or, could it be different in places that are more rural? According to Wikipedia, Atherton “has very restrictive zoning, only permitting one single-family home per acre and no sidewalks. This policy that prohibits homes from being on less than an acre.” But, imagine a place with even bigger lots and more room. Would denser housing in part of the community be perceived as less problematic by neighbors?
I am open to hearing about wealthy communities where affordable housing is desired and pursued.
Scholars who study ethnoburbs note the importance of Monterey Park, California. Here is one reason why:
Monterey Park, about seven miles east of downtown Los Angeles, has a population of about 60,000 people, about 65 percent of whom are Asian American and 27 percent are Hispanic or Latino, according to government data. In the 1990s, it claimed to have become the first city in the continental United States to have a majority of residents with Asian ancestry.
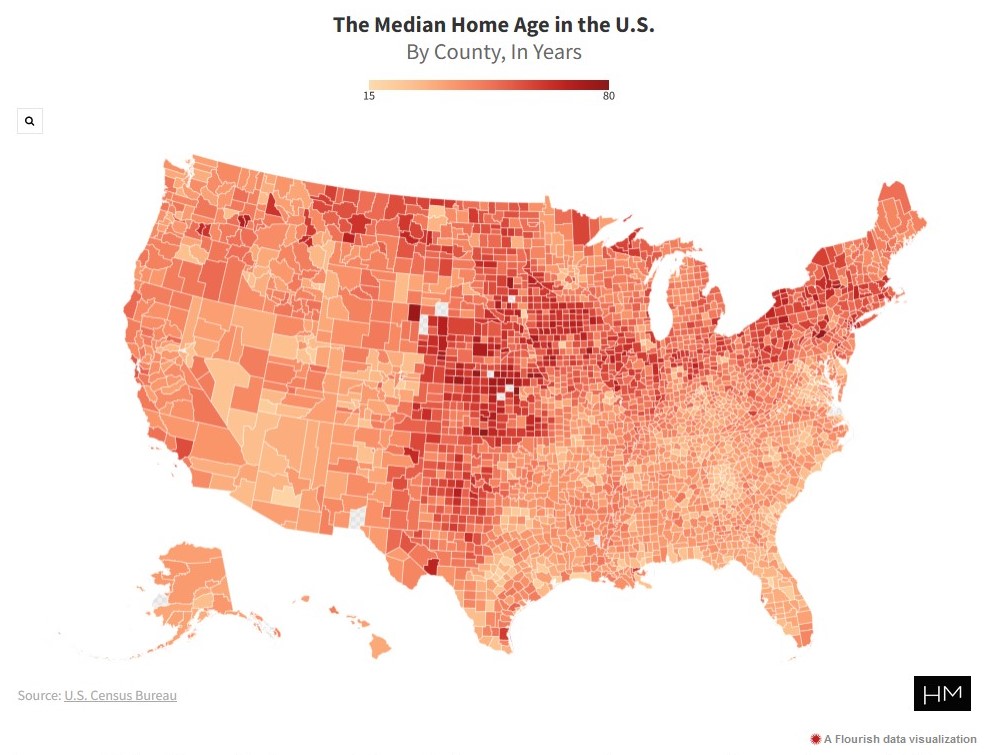
Age may just be a number, but when it comes to the age of a home, it can be an indicator of its style, features, or condition. It can even help tell a story about where it’s located. Home construction, especially in modern building, comes in waves in areas with new developments springing up as a city grows…
New York came in as the state with the oldest median home age in the U.S. at 63 years. Rhode Island was a few years younger at 60, followed closely by Massachusetts (59), Pennsylvania (57), and Connecticut (55). No surprise that the five states with the oldest median home age are all located in the northeast as they had some of the largest growth in early America.
At the other end of the spectrum, the five states with the youngest median home age are Nevada (26), Arizona (30), Utah (31), Georgia (31), and North Carolina and South Carolina tied at 32 years old. Nevada has been the fastest-growing state for roughly five decades so it follows that the homes would be the newest. Likewise, the other ‘youngest’ states have seen large population increases and the housing being built to satisfy the demand…
The county with the oldest median home age in the U.S. is Clay County, Kansas. The county’s median year of structure build is 1941, bringing the county’s median home age to 79 years. The Sunshine State of Florida holds the ‘youngest’ county in the country, with Sumter County, Florida having a median home age of 17 years.
The median is helpful here: half of the homes were constructed before, half after. I do not know if the Census reports this data but it would also be interesting to know the 25th and 75th percentiles or other points along the data distribution. Are there also places that have more compressed or longer ranges of development?
Is it surprising that there a good number of older county medians in the center of country, roughly running from Texas to the Dakotas?
This reminds me of Dolores Hayden’s book Building Suburbia: Green Fields and Urban Growth, 1820-2000. She details waves of suburban development, dependent on factors like transportation technologies and ideas about what suburbs should be and include.
What happens to the housing in the locations with older housing overall? What percent ends up fixed up and restored or designated as part of a historic district? In contrast, what percent is undesirable and not brought into a more modern era?
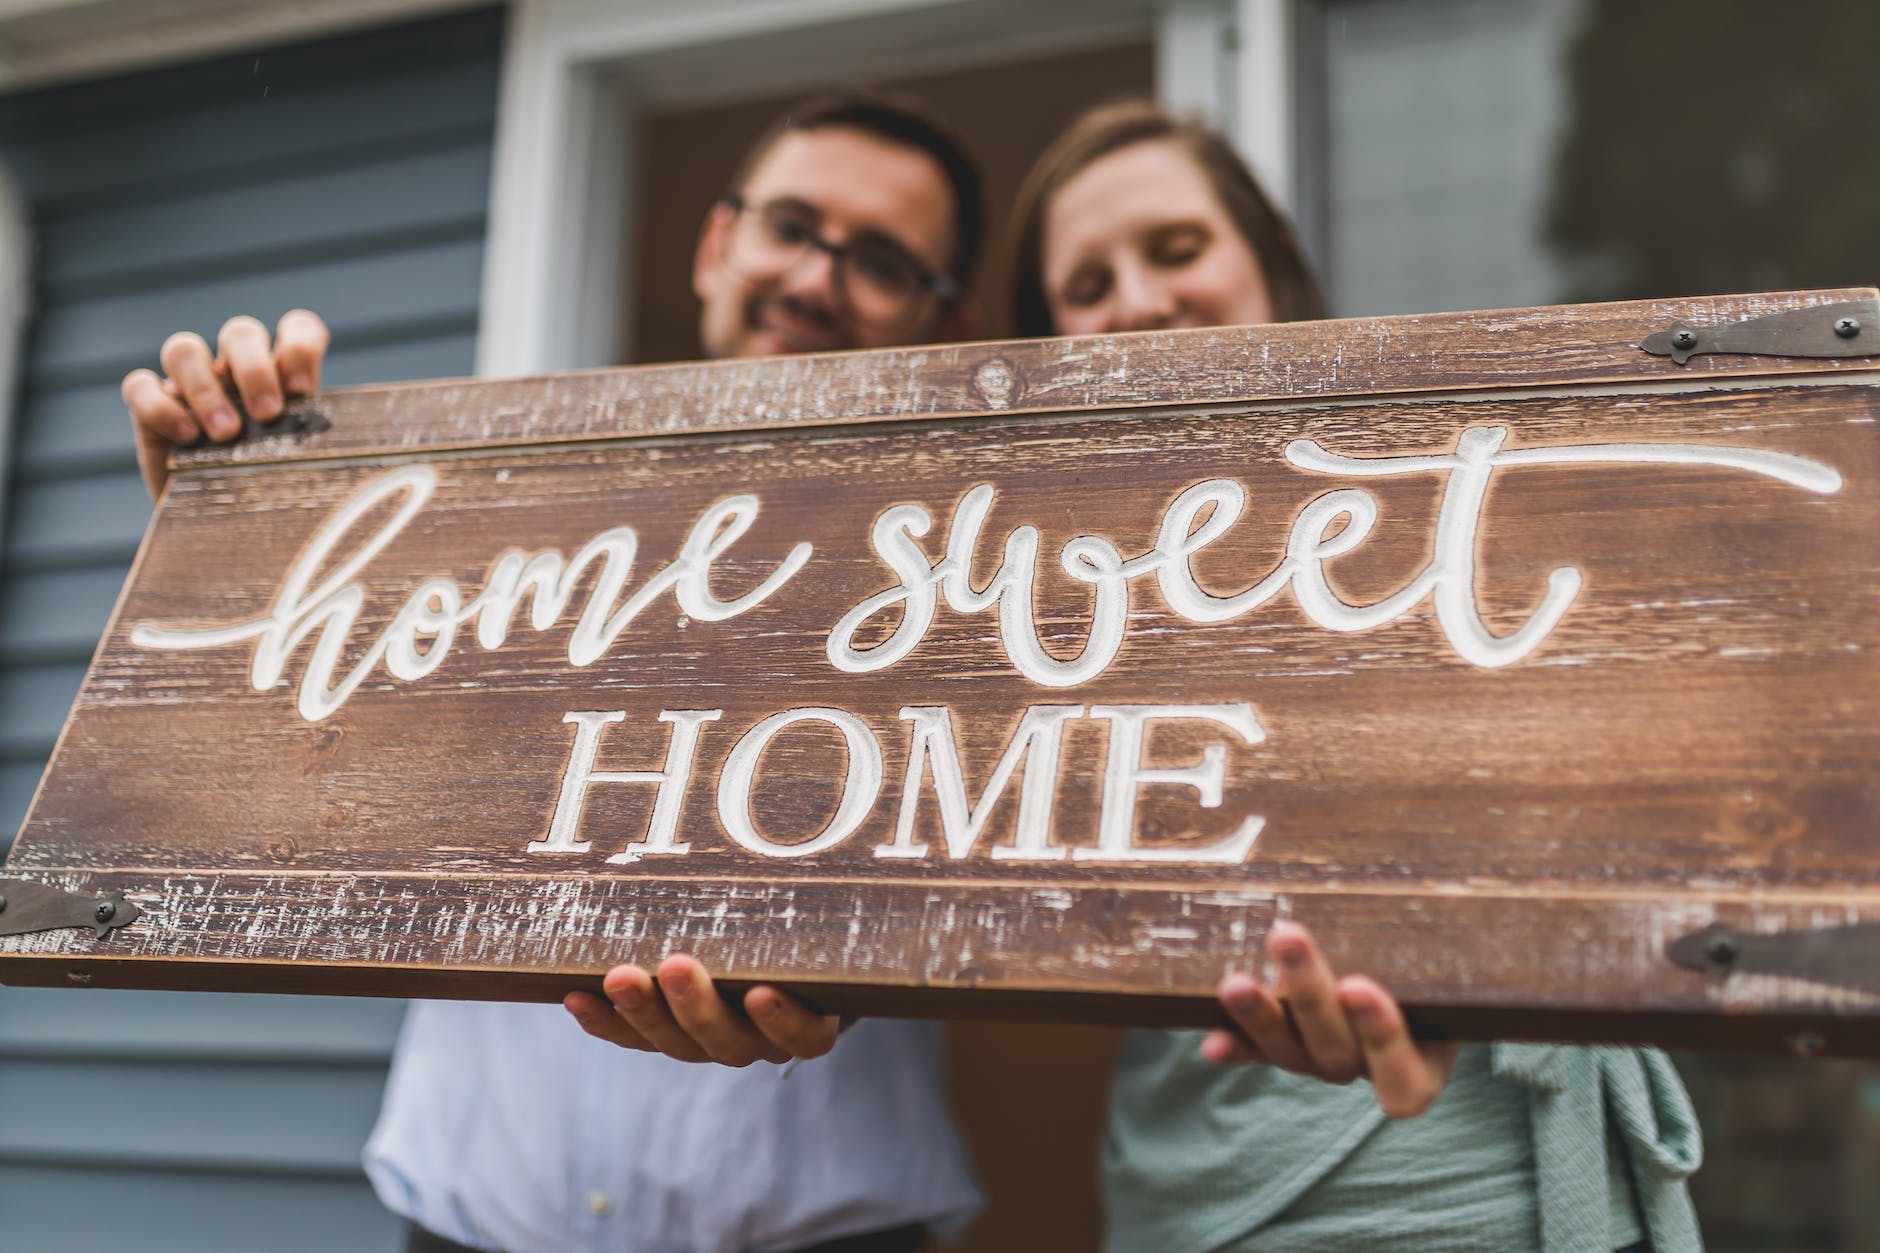
Photo by Miguel u00c1. Padriu00f1u00e1n on Pexels.com
Indeed, a Realtor.com report found that while starter homes — which it defines as all two-bedroom listings — seem unaffected by the current correction in the housing market, luxury homes have been feeling the full effects…
The price trajectory for luxury homes — which Realtor.com defines as the most expensive 10% of homes in any given market — however, went the opposite way.
Their prices “skyrocketed as the stock market surged and buyers sought more living space” during the pandemic: in the middle of 2021, there was a 40% year-over-year price increase for luxury homes but by the end of the year, the luxury market receded as recession fears increased. And in 2022, luxury homes have seen modest-to-stagnant price growth, around 2.5%, ending the year close to flat…
“If you think of luxury home purchases as discretionary, starter home purchases are almost the opposite,” Hale said in the report. “It’s more about timing and strategy.”
If starter homes are now more expensive due to demand and limited supply, does that make them more attractive to communities and developers to consider approving and building? One concern some communities have is that cheaper homes might devalue other homes in the community and/or bring different residents to a community. When they envision more affordable housing, they may have particular sets of people in mind.
In a note to clients earlier this month, Goldman Sachs forecasted that four American cities in particular should gear up for a seismic decline compared to that of the 2008 housing crash.
San Jose, California; Austin, Texas; Phoenix, Arizona; and San Diego, California will likely see boom and bust declines of more than 25%.
Such declines would rival those seen around 15 years ago during the Great Recession. Home prices across the United States fell around 27%, according to the S&P CoreLogic Case-Shiller index…
In 2023, the investment bank expects home prices to barely fall in cities like New York (-0.3%) and Chicago (-1.8%) while predicting higher prices in Baltimore (+0.5%) and Miami (+0.8%).
It make sense that a company interested in investments and finance would want to make such a prediction. Will it change people’s behavior? A few ways this might matter:
-Local homeowners try to sell now before the big decline or prepare to stay put longer so they can see an increase in values. Either way, the supply of homes for sale is affected.
-Builders and developers reduce their construction and plans. They wait to see how long such a decline lasts. They hope to weather this and have higher profit margins later.
-Local governments steel for the impacts to tax revenues and population growth.
-People who might consider moving to or investing in the area reconsider. Would lower housing values make the area more attractive? (This might conflict with fewer homes for sale.)
Does such a prediction become a self-fulfilling prophecy to some degree as people wait for the drop in home prices?
The house, which is still under construction, is now sporting a bright purple trim right around the multiple eaves, and from what we understand, the owner (who also owns the neighbouring section) is perfectly entitled to do this…
But not everyone is opposed to the colour. “Brings diversity and a spot of colour to the neighbourhood,” one wrote, while another suggested the owners must be Melbourne Storm rugby league supporters.
Negative comments about the design and colour (“Barbie McMansion”) are also slammed by other residents, who think homeowners should be free to do their own thing: “It’s not my cup of tea, but each to their own. They own the land and they build to their specifications, it doesn’t matter what anyone else thinks.”…
“Those colours should be illegal,” writes another local. “With all the compliance you need to go through to build anything I can’t believe this got through council. Go them if they like the colours and can navigate their way through the criteria.”
The discussion, as described here, seems to involve the property rights of the owners and whether such color and design are in good taste. There do not appear to be restrictions on the color. This would be true in many places in the United States that are not governed by homeowners associations or preservation guidelines. At the same time, official guidelines on colors are different than what people expect to see on homes. Purple is not a color that would be viewed favorably in many American neighborhoods. While it could fit in some locations where the color palette is different for exterior parts of houses, it would be viewed as inappropriate in many settings.
Mix these two discussion points regarding McMansions, homes that often involve property rights – can people build a giant house wherever they want or right next to homes of different sizes? – and aesthetic judgments – are McMansions out of proportion, built poorly, and badly designed? – and the simple choice of a trim color mixes with numerous emotions. It is hard to be neutral with such a negative term for a house.
In the long run, could the purple-trimmed McMansion end up becoming a kind of local oddity? Some might not want to live near such a home but others might find it interesting to view when out for a drive or as part of a varied local landscape.
About 4,500 Protestant churches closed in 2019, the last year data is available, with about 3,000 new churches opening, according to Lifeway Research. It was the first time the number of churches in the US hadn’t grown since the evangelical firm started studying the topic. With the pandemic speeding up a broader trend of Americans turning away from Christianity, researchers say the closures will only have accelerated…
“In the last three years, all signs are pointing to a continued pace of closures probably similar to 2019 or possibly higher, as there’s been a really rapid rise in American individuals who say they’re not religious.”
The rest of the article deals with why this is happening and what happens to these buildings.
For this post, I am more interested in putting the cited numbers in context. Here are different aspects of this:
As cross-sectional numbers (first sentence above), it is hard to know what do with these figures. In 2019, more Protestant churches closed than opened. This is a one year figure.
Looking at trends over time is useful. The next sentence above says this is the first time that more congregations have closed than opened since Lifeway started tracking this. So this is a reversal or change to a larger trend? How long has anyone tracked this? Is it assumed that it is good or normal that more churches open than close each year?
As noted above, there are fewer people claiming religious affiliation. Are there additional factors involved, such as a shift of attendees toward larger congregations?
Are there other data sources for the number of churches and what does their data show?
With the attention that is paid to the declining number of religious Americans, it would be helpful to continue to look at the corresponding organizational changes including changes in the number of congregations.
Neighbors have long bickered over fences, hedges and property borders. But lawyers involved in such tangles say the pandemic, which kept many people and their neighbors at home—and on one another’s nerves—far more, turned suburban sparring especially toxic. The rancor, they say, hasn’t eased up. Allegations of late have touched on topics including flying dirt, flowerpot placement and stray balls bouncing into a yard…
The leading reasons for flaps between neighbors are trees, fences, parking and noise, “probably in that order,” said Emily Doskow, a lawyer and mediator who edited the book “Neighbor Law.” “Everyone knows that having problems with your neighbors is one of the worst quality-of-life killers ever.”
The New York Peace Institute, a nonprofit that helps people resolve conflicts, got more calls during the pandemic about neighbor disputes, said Jessica Lopez, a program manager who coordinates mediations. Two years later, the caseload hasn’t slowed, she said, adding, “It’s a new normal.”
At the same time, as a sociologist, there are multiple questions I ask after reading this:
Is there a way to get data on this? Are the number of neighbor disputes up in the courts or in lawsuits? Not all disputes go to court; would qualitative data in communities also reveal this?
What exactly was the role of COVID-19 in this? One answer could be that more people spent time at home. Another could be that COVID-19 racheted up tension and disrupted regular social interactions. A third could be that rising property values and demand for property in some places pushed people to see their property differently.
How many communities have alternative options for mediating disputes like these rather than going to court? Are there implementable models that suburbs could offer?
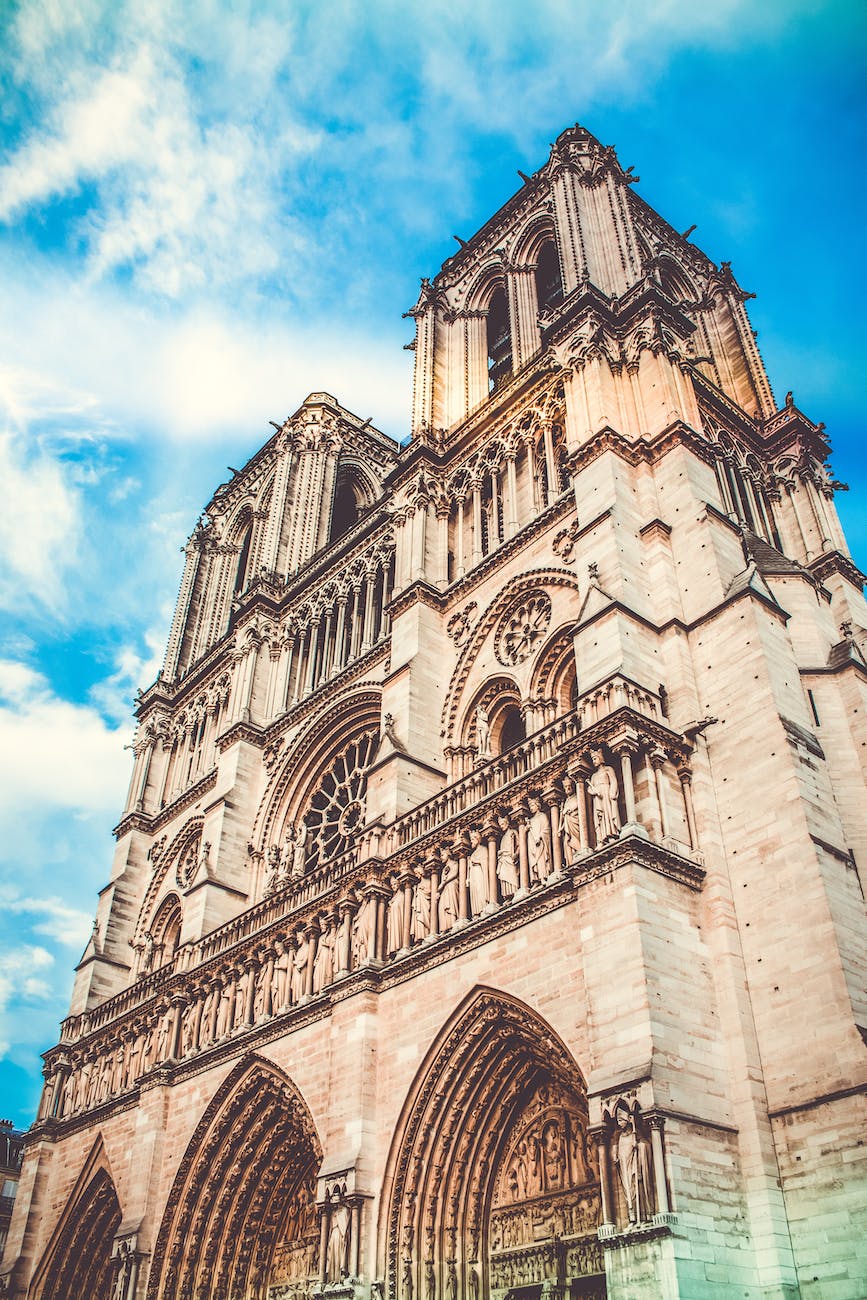
the Catholic Church is the largest nongovernmental property owner in the world
While there are no numbers on the number of properties, acres, or value, I would guess that it adds up to a lot. To serve over 1.3 billion adherents around the globe – 2019 pre-Covid figures – requires a number of buildings and properties all over the place.
Asking questions about how much property a religious group should own is another matter. Is one interested in efficiency and how many people are served through each property? Is there a religious group has too much property? Does it matter if the property serves the community as well as religious adherents? All of these could factor into whether the amount of land owned is seen as a moral good or a moral problem.
At the swearing-in this month for her third term as the District of Columbia’s mayor, Muriel Bowser delivered a surprising inaugural-address ultimatum of sorts to the federal government: Get your employees back to in-person work — or else vacate your lifeless downtown office buildings so we can fill the city with people again…
There are days when downtowns in other American towns can almost look like they did before 2020. In the 9-to-5 core of Washington, though, there’s no mistaking the 2023 reality with the pre-Covid world. Streets are noticeably emptier and businesses scarcer. Crime has ticked up. The city’s remarkable quarter-century run of population growth and economic dynamism and robust tax revenues seems in danger…
According to census data, Washington has the highest work-from-home rate in the country. Week-to-week numbers from the security firm Kastle Systems back this up: The company, whose key fobs are used in office buildings around the country (including the one that houses POLITICO), compiles real-time occupancy data based on card swipes in its 10 largest markets. D.C. is perennially dead last…
To people who depend on commuters’ lunch-hour spending or transit fees, the change is less welcome. According to John Falcicchio, the city’s economic-development boss and Bowser’s chief of staff, the federal government’s 200,000 D.C. jobs represent roughly a quarter of the total employment base; the government also occupies a third of Washington office space — not just the cabinet departments whose ornate headquarters dot Federal Triangle, but plenty of the faceless privately held buildings in the canyons around Farragut Square, too.
On one hand, Washington D.C. is in a unique situation. One employer, the federal government, is responsible for a sizable portion of the local workforce.
On the other hand, this is an issue facing many downtowns. Can asking companies to have workers return or applying threats be successful? Or, is it better to try to offer amenities and encouragements so workers want to return? As a third option, is it time to transition from the decades-long emphasis on commercial downtown space to residences and other uses?
This could be an inflection point for a number of downtowns or it could end up being a version of the same old approach. However, it would not surprise me if the conversation between local politicians and business leaders heats up around this issue.