Argument: mass transit service comes before demand

A history of the decline of mass transit in the United States concludes with this claim: there must be transit service in order to generate demand.

The story of American transit didn’t have to turn out this way. Look again at Toronto. It’s much like American cities, with sprawling suburbs and a newer postwar subway system. But instead of relying on park-and-ride, Toronto chose to also provide frequent bus service to all of its new suburbs. (It also is nearly alone in North America in maintaining a well-used legacy streetcar network.) Even Toronto’s suburbanites are heavy transit users, thanks to the good service they enjoy.

Likewise, in Europe, even as urban areas expanded dramatically with the construction of suburbs and new towns, planners designed these communities in ways that made transit use still feasible, building many of them around train stations. When cities like Paris, London, and Berlin eliminated their streetcar networks, they replaced them with comparable bus service.

Service drives demand. When riders started to switch to the car in the early postwar years, American transit systems almost universally cut service to restore their financial viability. But this drove more people away, producing a vicious cycle until just about everybody who could drive, drove. In the fastest-growing areas, little or no transit was provided at all, because it was deemed to be not economically viable. Therefore, new suburbs had to be entirely auto-oriented. As poverty suburbanizes, and as more jobs are located in suburban areas, the inaccessibility of transit on a regional scale is becoming a crisis.

The only way to reverse the vicious cycle in the U.S. is by providing better service up front. The riders might not come on day one, but numerous examples, from cities like Phoenix and Seattle, have shown that better service will attract more riders. This can, in turn, produce a virtuous cycle where more riders justify further improved service—as well as providing a stronger political base of support.

I wonder how much infrastructure – largely paid for by taxpayers and serving the public – differs from other kinds of innovation. Sometimes, new products meet a clear demand. At other times, a new product generates new demand that people did not even know existed.

Furthermore, let’s say for the sake of argument that this claim is true: building more mass transit lines and options would eventually increase demand. Municipalities and governments would still be left with a tricky issue: is there enough will or enough resources to pay what can be massive costs up front with a promised payoff in the future? Long-term thinking is not necessary something Americans have done well in recent decades. (And this does not even include the possibility that the big investment might not pay off.)

Finally, another way to approach this is to start with smaller-scale projects, show people that they work, and then build up to a larger structure. In many American communities, this would mean starting with bus service since plenty of roads already exist. But, many Americans do not like buses. They may be more likely to take trains but these require a lot more work and money.

Shipping via truck and railroad in a strong economy

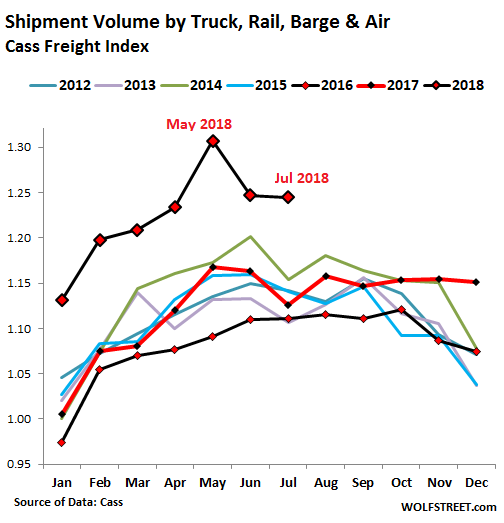
If the economy is going well, the trucking and railroad industries have plenty of work to do:

The dynamics in the transportation sector are “clearly signaling that the US economy, at least for now, is ignoring all of the angst coming out of Washington D.C. about the trade wars,” the report by Cass said.

The Cass Shipments Index does not include shipments of bulk commodities, such as grains or chemicals. But shipments of commodities were strong too, according to the Association of American Railroads. Excluding the carload category of coal, which is facing a structural decline in the US, carloads rose by 6.7% year-over-year, including grain, up 14.7%; petroleum & petroleum products, up 27%; and chemicals, up 4.6%. Of the 20 commodity carload categories, only five showed declines, including nonmetallic minerals, metallic ores, and the biggie, coal.

And intermodal traffic – shipments of containers and trailers via a combination of rail and truck – surged 6.9% in July compared to July last year, the AAR reported.

At the least, this is just a reminder of how goods make their way to stores and eventually buyer’s residences. Those trucks and trains may be a nuisance when you want to get where you want to go but this is how it works in our society.

A few other thoughts:

  1. It is hard to imagine drones could make up for all or even many of the goods shipped by trucks and trains. Or, imagine drones like swarms of locusts.
  2. The shipping industry is another one highly affected by economic swings. Like the construction and housing industries, when times are good, there is a lot of need for goods to be moved around. When a recession hits, all that equipment and all those employees are not needed.
  3. Of course, there is an international component to all of this where goods have to enter or leave countries. That all happens on a consistent even with all the rhetoric regarding trade wars and trade agreements. I remember going past some of the shipping yards in Hong Kong and being amazed at the size of the facilities: cargo containers in huge piles for as far as one could see.

CREATE plan slowly moves to address Chicago area railroad congestion

An expensive and sizable project aims to solve the train congestion in the Chicago region:

CREATE takes an incremental approach to fixing rail gridlock in the suburbs and Chicago, the nation’s busiest rail hub.

One overpass here, two extra tracks there, and eventually freight trains will be chugging along instead of noisily idling in your neighborhood while emitting diesel fumes.

The downside is the cost — a staggering $4.4 billion to fix the region’s outdated rail infrastructure.

Despite funding challenges, 29 out of 70 CREATE projects in the region have been completed with $1 billion spent, Association of American Railroads Chief Engineer for CREATE William Thompson explained during a recent tour…

The Chicago region handles a whopping 25 percent of freight traffic in the U.S. That means almost 500 freight trains and 760 Metra and Amtrak trains pass through the region daily. Completing the Chicago Region Environmental and Transportation Efficiency Program that builds bridges and new track will mean the metro area can host 50,000 more freight trains a year by 2051.

The Chicago area is a critical railroad hub for the entire nation. Yet, given the amount of development in the region, making significant changes is difficult. For example, construction at O’Hare Airport is held up by a dispute over railroad land adjacent to the busy facility. Or, suburban residents and communities do not like it when freight traffic is increased near them even if benefits the region as a whole. Or, getting rid of the many at-grade crossings is a slow process. This is another good illustration of how foresight – addressing these issues decades ago as the region was growing at a face pace – could have cut off numerous later issues.

Also, I am intrigued by the last line from the article quoted above. I assume most of the region’s residents would assume that the amount of time and money poured into this project would eventually mean that they would encounter fewer trains. And this might be the case if more bridges, underpasses, and routes around the outskirts of the region limit the vehicular contact with trains. Yet, increasing the number of freight trains by 50,000 means more noise and possibly more traffic issues at the points in the transportation grid where trains and vehicles still come in contact. Would the majority of residents want 50,000 new trains? I would guess no even if it is essential to their day-to-day lives (delivering goods and food, etc.).


10 South Canal Street in Chicago contains a building part of NSA Internet surveillance

The Intercept claims to have identified 8 major U.S. cities that have a building where the NSA spies on telecommunications through AT&T facilities. Here is the photo from the story of 10 South Canal Street in Chicago as well some of the background of the building:

https://theintercept.com/2018/06/25/att-internet-nsa-spy-hubs/

10 South Canal Street, Chicago, IL


Like many other major telecommunications hubs built during the late 1960s and early 1970s, the Chicago AT&T building was designed amid the Cold War to withstand a nuclear attack. The 538-foot skyscraper, located in the West Loop Gate area of the city, was completed in 1971. There are windows at both the top and bottom of the vast concrete structure, but 18 of its 28 floors are windowless…


10 South Canal Street originally contained a million-gallon oil tank, turbine generators, and a water well, so that it could continue to function for more than two weeks without electricity or water from the city, according to Illinois broadcaster WBEZ. The building is “anchored in bedrock, which helps support the weight of the equipment inside, and gives it extra resistance to bomb blasts or earthquakes,” WBEZ reported.

Today, the facility contains six large V-16 yellow Caterpillar generators that can provide backup electricity in the event of a power failure, according to the Chicago Sun Times. Inside the skyscraper, AT&T stores some 200,000 gallons of diesel fuel, enough to run the generators for 40 days.

NSA and AT&T maps point to the Chicago facility as being one of the “peering” hubs, which process internet traffic as part of the NSA surveillance program code-named FAIRVIEW. Philip Long, who was employed by AT&T for more than two decades as a technician servicing its networks, confirmed that the Chicago site was one of eight primary AT&T “Service Node Routing Complexes,” or SNRCs, in the U.S. NSA documents explicitly describe tapping into flows of data at all eight of these sites.

It is common that cities have buildings that may be hiding something, ranging from telecommunication structures to power substations to fake facades to hide subways or rail lines. But, I assume very few people would guess that a rather normal looking city structure could be part of an Internet surveillance program. I’m not sure what people would do with this knowledge. Protest outside? Give it a wide berth by not traveling near it? Chalk it up as a local oddity and then move on with normal life?

Saving 40 gallons a week in water when I pay low prices per 1000 gallons every two months

I recently used a body wash that said on the back: “Did you know by reducing your shower by 2 minutes you can save an average of 40 gallons of water/week?” Water conservation is a laudable goal. Yet, the way our water bill was structured in our previous homes – the prices plus the measurement of the water use – illustrates how it can be difficult to convince Americans to use less water.

In our former home, our bill was structured this way:

  • We paid every two months.
  • The water use was measured in 1000s of gallons. For a family of three, we regularly used 9,000-10,000 gallons.
  • We paid $1.50 for 1,000 gallons of water and $2.98 for 1,000 gallons of sewer usage.

Several features of this structure would make it more difficult to care about conservation:

  • A two month time period was too long to see real changes in the bill. A significant change in water usage, say from watering plants during a hot period or the presence of visitors, would not create that much change over two months.
  • Using 40 gallons less water per week would only lead to 320 less gallons over two months. This might affect a bill but only by one 1000 unit of water, if at all. This is too large of a unit for residents to think about. Our current water usage is measured in 100 cu feet of water, a unit that is very difficult to visualize or connect to everyday usage.
  • The water price was really cheap. If we used 3,000 more gallons over two months, the cost was minimal: $4.50 in added costs for water and $8.94 in added sewer costs. The financial incentive to save water is reduced at such cheap rates.

A number of scholars have argued that Americans pay too little for water. This has negative consequences, such as wealthier residents using more water and cities losing lots of water before it gets to users. These problems could be addressed, even without immediately jumping to higher prices. Some of these techniques are already in use with utility bills:

  • Bill users more frequently (monthly).
  • Provide ways to show real-time water use.
  • Compare users to other nearby users. This can help people who use a lot of water see “more normal” use.
  • Show the bill in smaller water units that make sense to people. What is 1,000 gallons?

Raising prices could help too.

Chicago’s road construction in the long term

Curbed Chicago provides an update on the city’s work to resurface streets:

[T]he city rolls out plans to resurface 135 miles of streets, according to an announcement from the mayor’s office.

The work is expected to begin mid-April when the asphalt plants open for the 2018 construction season. The Chicago Department of Transportation and the Department of Water Management are leading the project and plan to resurface at least 275 miles by the end of the year.

Since 2011, more than 1,850 miles of streets and alleyways have been resurfaced (that’s out of the city’s 4,600 miles of roadways).

If these numbers are roughly consistent on a yearly basis, it would take 17 years to resurface everything. On the city’s page for Streets, Alleys, and Sidewalks, there is no description of how long an overall cycle might take. But, there might be some mitigating factors affecting which roadways are addressed: particularly bad pothole seasons that cause damage and draw attention and roads that are used much more than others.

And while residents may not be fond of all of this construction, roadways are a constant work in progress. Given the American emphasis on driving, they get a lot of use for commuting, trips within the community, and delivering goods and services. Poor roads do not look good for the local government and could impede activity. Residents can get unhappy pretty quickly if they feel their tax dollars are not leading to good roadways. Yet, if people truly do not want construction, they should really consider driving less and helping to create places with less driving so that the roads last longer.

Infrastructure grade for Illinois: C-

The infrastructure of Illinois did not receive a good grade in a recent report from the American Society of Civil Engineers:

The overall Illinois grade was a combination of individual grades for different elements of state infrastructure, including aviation, bridges, drinking water systems and rail.

The card’s lowest individual grade — a D- — went to the care of navigable waterways, noting that the confluence of the Illinois, Mississippi and Ohio rivers are crucial to the country’s navigation system. But this advantage is threatened by deferred maintenance on locks that have “long exceeded” their 50-year design life, the group said.

Illinois’ roads got a D, as they are ranked third worst nationally for travel delay, excess fuel consumed, truck congestion cost and total congestion cost, the engineers’ report found. The report noted that despite the need for maintenance and repair, the state’s 19-cent-per gallon fuel tax has remained the same since 1991. Other states have raised their gas taxes in recent years to fund road programs.

Illinois transit also got a D, because of lack of capital funding, according to the society.

This is not just a concern because Illinois is a populous state where many people rely on the infrastructure. This also matters because Illinois depends on this infrastructure quite a bit for industry and business. Because of the state’s location roughly in the middle of the country plus containing a path from the Great Lakes to the Mississippi River and numerous busy facilities that enable travel and the shipping of freight (railroad lines, O’Hare and Midway Airports, intermodal facilities), Illinois’ infrastructure is particularly important as it helps make many other things happen.

Despite its importance, I’m not sure I hold out much hope that significant efforts will be made to maintain and upgrade the infrastructure in Illinois given the state’s budget and political issues. Illinois could be a fantastic example of a state that builds for the future by comprehensively addressing infrastructure here and now to set up future decades.

New standard and platform for city maps

Maps are important for many users these days and a new open data standard and platform aims to bring all the street data together:

Using giant GIS databases, cities from Boston to San Diego maintain master street maps to guide their transportation and safety decisions. But there’s no standard format for that data. Where are the intersections? How long are the curbs? Where’s the median? It varies from city to city, and map to map.

That’s a problem as more private transportation services flood the roads. If a city needs to communicate street closures or parking regulations to Uber drivers, or Google Maps users, or new dockless bikesharing services—which all use proprietary digital maps of their own—any confusion could mean the difference between smooth traffic and carpocalypse.

And, perhaps more importantly, it goes the other way too: Cities struggle to obtain and translate the trip data they get from private companies (if they can get their hands on it, which isn’t always the case) when their map formats don’t match up.

A team of street design and transportation data experts believes it has a solution. On Thursday, the National Association of City Transportation Officials and the nonprofit Open Transport Partnership launched a new open data standard and digital platform for mapping and sharing city streets. It might sound wonky, but the implications are big: SharedStreets brings public agencies, private companies, and civic hackers onto the same page, with the collective goal of creating safer, more efficient, and democratic transportation networks.

It will be interesting whether this step forward simply makes what is currently happening easier to manage or whether this will be a catalyst for new opportunities. In a number of domains, having access to data is necessary before creative ideas and new collaborations can emerge.

This also highlights how more of our infrastructure is entering a digital realm. I assume there are at least a few people who are worried about this. For example, what happens if the computers go down or all the data is lost? Does the digital distance from physical realities – streets are tangible things, not just manipulable objects on a screen – remove us from authentic streetlife? Data like this may no be no substitute for a Jane Jacobs-esque immersion in vibrant blocks.

“People care about flooding…they don’t care about stormwater management”

An article discussing the difficulties of avoiding flooding in a sprawling city like Houston includes this summary of a key problem:

One problem is that people care about flooding, because it’s dramatic and catastrophic. They don’t care about stormwater management, which is where the real issue lies. Even if it takes weeks or months, after Harvey subsides, public interest will decay too. Debo notes that traffic policy is an easier urban planning problem for ordinary folk, because it happens every day.

It is difficult to get people interested in infrastructure that does not effect them daily or they do not see it. Yet, flooding is a regular issue in many cities and suburban areas and it can be very hard to remedy once development has already occurred. Indeed, it is difficult imagine abandoning full cities or major developments:

The hardest part of managing urban flooding is reconciling it with Americans’ insistence that they can and should be able to live, work, and play anywhere. Waterborne transit was a key driver of urban development, and it’s inevitable that cities have grown where flooding is prevalent. But there are some regions that just shouldn’t become cities.

Given the regularity of flooding in developed areas, it is interesting to consider that there are not more solutions available in the short-term. Portable and massive levees? Water gates that can be quickly installed? Superfast pumps that can remove water?

Rhode Island signs give cost, time under construction data

For over a year, Rhode Island has posted interesting signs in roadway construction areas:

Along with the name of the project, the signs note its estimated cost, the expected completion time, and a stoplight-style red, yellow and green dot system to show whether the project is “on-time and on-budget.”

“RIDOT believes the signs provide accountability and transparency by keeping the public aware of the status of the projects and helps keep the Department’s [project management] staff responsible for delivering them on time and on budget,” wrote DOT spokesman Charles St. Martin in an email…

Projects scheduled to finish on or before their expected completion date get green dots on their RhodeWorks signs. Projects that are behind schedule by six months or less get yellow dots on their signs and projects more than six months late get red dots.

There are no yellow dots on the budget side. Projects are either on budget and green or over budget and red.

Given how easy it is for infrastructure projects to go over time and over budget, this is an interesting approach. At the least, it provides the driver – the taxpayer – some idea of whether the project is meeting several key goals. However, as the article notes, it is less clear how this public information than translates into change in completing projects. Perhaps future signs should include additional information:

-The cost to everyone for the extra time and money involved (if the project is indeed over budget and past its intended completion date). Think of the business lost and the time wasted in traffic.

-Changes to the infrastructure process as a result of what was learned in this particular project.

-The punishment meted out to contractors and/or government officials for not meeting the goals.

I wonder if one incentive of making this data public is to overinflate cost and completion estimates so as to avoid public scrutiny through the signs.