Communities and character in one slide

In putting together material for the upcoming semester, I found myself summarizing my work on studying the character of particular suburbs. Here is the slide that explains the process:

CommunitiesCharacterSlide

A quick explanation of the (simplified) process depicted on the slide:

  1. Every community or neighborhood has characteristics and circumstances at its founding. These starting traits can prove influential down the road.
  2. Once started, the community continues through inertia. People live their lives.
  3. There are points in time – which I call “character moments” in a 2013 article – where the inertia of communities are disrupted. This often comes in the form of external forces that place pressure on a community. For example, my 2013 article looked at what happened when three suburbs felt suburbanization pressure in the Chicago region after World War II. This led to internal discussions in each suburb about how they wanted to respond and what they viewed as their future. One of the suburbs, Naperville, decided to lean into the growth: they annexed a lot of land, developed guidelines for growth, and experienced multiple decades of explosive growth (read more in my 2016 article on the difficulties explaining these changes in Naperville).
  4. Different decisions in communities will lead to different future paths.
  5. Then, the inertia, external forces, and internal discussions and decisions repeat as circumstances arise. These key decisions build on each other over time which leads communities to be different places and feel different. This is an iterative process and communities can change course.

The ways this plays out in unique communities can differ greatly even as the process looks similar.

(To read more of what helped me think about this starting in graduate school as I looked to enact my interests in urban sociology and the sociology of culture, see this 2000 article titled “History Repeats Itself, But How? City Character, Urban Tradition, and the Accomplishment of Place.”)

Carmageddon in Los Angeles vs. Carmageddon in New York City

Remember Carmageddon and Carmageddon II in Los Angeles? Now, Carmageddon has come to New York City:

In Chicago and in other cities with robust transit systems, people who have never owned cars before are suddenly buying them. In New York City, some are calling it “carmaggedon,” as residents there registered 40,000 new cars in July, the highest monthly total in years. Meanwhile, NYC subway ridership is still down more than 75% from last year.

pexels-photo-1116244.jpeg

Photo by Jack Gittoes on Pexels.com

The difference in what leads to carmageddon in each city is striking. In Los Angeles, closing a section of a major highway is a problem for the entire system. Because of the emphasis on driving and the various chokepoints in the road system, a single closure has ripple effects. In New York City, the opposite is the case: high mass transit use, particularly in Manhattan and denser parts of the city, is necessary. If something threatens the mass transit lines – here, it is an unwillingness to use mass transit when there is a pandemic – then too many cars may be on roads that cannot handle the increased volume.

Fortunately for Los Angeles and unfortunately for New York, the length of Carmageddon matters. Closing a major highway for just a few days is survivable. Indeed, Los Angeles got out ahead of the problem and enough drivers were able to make alternate plans. Decreased mass transit use due to COVID-19 is another story. How long will the virus be around? Will there be a point where residents return to mass transit even with the threat of the virus present? Carmageddon in New York might prove more lengthy and much more difficult to remedy.

TN town built to construct atomic bomb helped inspire postwar suburbia

A story connecting Chicago to the development of the atomic bomb included this paragraph about Oak Ridge, Tennessee:

OakRidgeTN

Aerial image of Oak Ridge, Tennessee (via Google Maps)

The decision had already been made that the atomic bomb would be manufactured in a rural stretch of eastern Tennessee. Designated “Site X,” it quickly became Oak Ridge, a city of 30,000 — designed and constructed under the strictest security. The architects of Chicago-based Skidmore, Owings & Merrill had to draft a master plan without knowing where it would be built. Oak Ridge’s curving roads, dotted with clusters of single-family homes, would become a template for the postwar suburban building boom.

The classic historical work Crabgrass Frontier includes this bit about Oak Ridge:

The mobile home park concept was pioneered in the 1920s and 1930s, but the largest experiment with manufactured or prefabricated houses came in World War II. This 1945 aerial photograph was taken of a part of Oak Ridge, Tennessee, a community that not even existed in 1940. In the next few years as atomic workers poured into the area, more than 5,000 trailers supplemented 9,600 prefabricated houses and 16,000 barracks to provide temporary dwellings in this top-secret facility.

Another scholar connects Oak Ridge and Levittown:

His Levittown wasn’t so very different from the utopian plan of Oak Ridge, Tennessee, designed during the way by the prestigious architectural firm of Skidmore, Owings, Merrill, a community itself modeled in part after the TVA communities of the Depression-era utopian Roosevelt planners.

One irony is that the development of the atomic bomb helped lead to existential fear in later suburbs even as the development process helped pave the way for more suburbia.

A connected thought: this is another way that World War II helped contribute to the subsequent decades of sprawling suburbs. In addition to Oak Ridge, World War II helped lead to new loans for returning veterans, pent-up demand for housing (add the war to the Great Depression and little had been built in roughly 16 years), the flowering of the American Dream as including a suburban home (already partly in place in the 1920s), and postwar prosperity with the United States emerging as a victor.


Naperville named best place in the US to raise a family

Niche’s 2020 rankings put Naperville at the top of the list of best places to raise a family. Here is how they rated the large suburb:

NicheNapervilleJul2020

This is not an unusual plaudit for Naperville; a variety of publications have rated Naperville highly over the last two decades (previous posts here, here, and here). The community is wealthy, has a lot of amenities, and grew tremendously in the last few decades of the twentieth century.

Still, it is interesting to see what Niche says is better or worse about Naperville. Schools excellent. Housing good – not the cheapest suburb in the Chicago area but Midwestern and Southern home values are cheaper compared to coastal locations. Lots of good things for families. Good nightlife. Good diversity (perhaps for suburbs but not so much among America’s bigger communities).  Crime and safety is the lowest – though still a B- – even as Naperville is one of the safest big communities in the country!

Across rankings of communities, Naperville tends to do well. Whether it can maintain this reputation remains to be seen as city leaders and residents consider possible changes in future decades to a suburb that has little land remaining for single-family homes or low-density housing.

Do we know that 500,000 people have fled NYC since the start of COVID-19?

On the heels of much discussion of residents leaving New York City, San Francisco, and other major cities because of COVID-19, the Daily Mail suggests 500,000 people have left New York City:

vehicles on road between high rise buildings

Photo by Craig Adderley on Pexels.com

Parts of Manhattan, famously the ‘city that never sleeps’, have begun to resemble a ghost town since 500,000 mostly wealthy and middle-class residents fled when Covid-19 struck in March.

The number is also part of the headline.

But, how do we know this number is accurate? If there was ever a figure that required some serious triangulation, this could be it. Most of the news stories I have seen on people fleeing cities rely on real estate agents and movers who have close contact with people going from one place to another. Those articles rarely mention figures, settling for vaguer pronouncements about trends or patterns. Better data could come from sources like utility companies (presumably there would be a drop in the consumption of electricity and water), the post office (how many people have changed addresses), and more systematic analyses of real estate records.

A further point about the supposed figure: even if it is accurate, it does not reveal much about long-term trends. Again, the stories on this phenomenon have hinted that some of those people who left will never return while some do want to get back. We will not know until some time has gone by after the COVID-19 pandemic slows down or disappears. Particularly for those with resources, will they sell their New York property or will they sit on it for a while to give themselves options or in order to make sure they get a decent return on it? This may be a shocking figure now but it could turn out in a year or two to mean very little if many of those same people return to the city.

In other words, I would wait to see if this number is trustworthy and if so, what exactly it means in the future. As sociologist Joel Best cautions around numbers that seem shocking, it helps to ask good questions about where the data comes from, how accurate it is, and what it means.

Losing population in other Illinois cities

Chicago gets a lot of attention for losing population but it is not the only Illinois city facing that issue:

RockfordCityWebsiteJune1120

Rockford, Illinois website – https://rockfordil.gov/

Decatur, in central Illinois about 40 miles east of Springfield, has lost 7.1% of its population since the 2010 census, according to the recently released 2019 population estimates. That drop is the third-largest percentage loss in the U.S. among cities with a population of 50,000 or more. Rockford comes in at No. 15 on that list. The northern Illinois city, the fifth-largest in the state with an estimated 145,609 residents, has lost 5% of its population during that nine-year period.

Rockford’s total population loss of 7,676 people over the last decade places it ninth nationwide among large cities, according to the U.S. Census Bureau, with Decatur (-5,385) at No. 15. Four of the five cities that have lost the most people since the last census are in the Midwest. Detroit has lost the most people, about 43,000, since 2010, followed by Baltimore, St. Louis, Cleveland and Toledo, Ohio…

“I think those cities are very susceptible to having populations hurt by the new service economy or the new postindustrial economy, and that’s because they have such a historical reliance, and a current reliance, on manufacturing and heavy-duty industry,” Wilson said. “And for those city economies that have not diversified, they really get hurt, they get pummeled. And what does that mean to get pummeled? People have a very difficult time living there and earning a living wage. They simply can’t make ends meet. And they become primed for thinking about leaving and trying to find something better.”…

“It’s going to create a further divide between the haves and the have-nots in places like Joliet, Aurora, Rockford,” Wilson said. “And people are going to want to leave.”

Three quick thoughts:

1. The population growth of the Sun Belt is a major force in American change in recent decades. Americans obsess over population growth and it is not in the Midwest so status and attention goes elsewhere.

2. This reminds me of Jennifer Egan’s book Look at Me where one of the main characters dreams of restoring Rockford to flourishing and growth. Yet, it is hard to imagine cities like Rockford or Decatur recapturing their past glory or entering a significant revival.

3. The narrative around population loss in Chicago often revolves around problems specific to Chicago. But, this article hints that it is a state-wide issue or a regional issue. If true, this would require a more coordinated effort across communities and groups that sometimes spend more time sniping at each other than working together (for example, feuds Illinois has with Indiana and Wisconsin rather than regional cooperation).


Addressing race at Wheaton College and in Wheaton, Illinois

In late 2015, Solidarity Cabinet at Wheaton College asked me to give an evening talk alongside one of my colleagues, David Malone, then Associate Professor of Library Science and head of Special Collections at Wheaton College (and now Dean of University & Seminary Library at Calvin College). We gave talks about the history of race at Wheaton College and in Wheaton, Illinois. Afterward, we discussed how even though these had been independent projects, the data and patterns we had uncovered across the two communities appeared to overlap.

In late 2019, the Journal of the Illinois State Historical Society published our article titled “Race, Town, and Gown: A White Christian College and a White Suburb Address Race.”

RaceTownandGown2019FirstPage

The synopsis from the journal’s website:

Our final article traces the trajectory of racial attitudes and policies in an affluent Chicago suburb. In “Race, Town, and Gown: A White Christian College and a White Suburb Address Race,” Brian J. Miller and David B. Malone summarize the evolution of Wheaton College and the larger community of Wheaton, Illinois on matters of race. Before the Civil War both college and town were well-known for abolitionism and relatively enlightened racial views. By the late nineteenth century, however, that earlier openness to African American uplift was waning fast. At the college, the reform ferment of the antebellum era gave way to evangelical fundamentalism, steering the college in more conservative directions. Meanwhile, as the town of Wheaton suburbanized after World War II, the new affluence it residents enjoyed corresponded with a more conservative approach to racial integration at the heart of the postwar Civil Rights Movement. The history of racial tolerance that had defined both college and town at their founding, while remaining a point of pride to be remembered, seemed only that, a distant memory. Miller and Malone, however, point to this history to make an important point–that structural economic and social change, coupled with new ideas, profoundly influence institutional and cultural change over time. Wheaton College and the larger suburb of which it is a part can, and no doubt will, continue to evolve, perhaps in surprising directions.

In certain ways, these communities exemplify broader trends in American society: how white evangelicals and white and wealthy suburbs address race. What is more unique in these two particular cases is that at certain points in their history, they were welcoming toward Blacks and minorities, particularly compared to some of their counterparts. Then, a combination of internal decisions and larger societal pressures which then shaped subsequent actions and experiences led to them being less welcoming. The character of places and communities is malleable even as a certain inertia takes hold over time. As as we note (and the editor notes in the paragraph above), communities and institutions can change again.


Changed suburban spending because of COVID-19, Naperville edition

While most public attention with COVID-19 has focused on big cities and countries, numerous suburbs will deal with the effects of the pandemic as well. Here is how Naperville, a large and well-off suburb, is planning to tackle a budget gap:

The city of Naperville is shaving nearly $25 million off its 2020 budget in the wake of the economic downturn caused by the coronavirus pandemic…

City Manager Doug Krieger said some of the projects were selected to be postponed because they’re considered “nice-to-haves” and aren’t expected to cost significantly more to be completed in future years. One major project, a $2.6 million plan to improve downtown streetscapes, was included on the list for deferment because “the downtown merchants did not want to proceed” with it in light of the pandemic, he said.

The moves will help the city offset anticipated declines in revenue sources — such as sales tax, food and beverage tax and motor fuel tax — as residents and businesses continue to follow the stay-at-home order…

Other work that will not take place this year includes $9 million in water meter-reading technology upgrades, a $7 million road widening project on North Aurora Road and $1.1 million of work toward a park at 430 S. Washington St. to be built in conjunction with North Central College, as well as smaller projects such as LED lighting conversion, tree planting, electric vehicle charging stations, flooring replacements and conference room IT and electric upgrades.

Suburbs and other municipalities can generate tax revenue through several sources (as noted above). Property taxes are affected by property values, which appear at this point appear to be holding firm during COVID-19. Sales taxes are generated by local businesses; this will certainly be down in communities (though the decline of retailers was already an issue). Food and beverage taxes will be down. And the number of people buying gasoline – feeding into the motor fuel tax – is down (and projections for the state’s funding through this suggest a big dip). In Illinois, we are near a third month of reduced business and social activity and this will make a big dent in municipal finances.

At the same time, based on the descriptions here, it sounds like an average resident of Naperville would not even notice that these improvements are not addressed this year. Of course, it could create a backlog for future years – pushing projects down the road means other planned projects might be delayed later – but the focus is on helping to address the current issues.

Naperville may be an unusual case compared to many other suburbs. It is a big community with a lot of successful businesses. The local government prides itself on being well-run and stable. It is not clear how long Naperville could continue to work through budget shortfalls but it is likely better prepared for this than many places.

This means that many municipalities could be facing tough questions in the months ahead about local projects and local funding. If the federal government and states are struggling with missed revenues, this will certainly affect municipalities who have to address local budget issues.

Subways and individual cars during COVID-19

A new study suggests New York City’s subway system helped spread COVID-19:

The paper, by MIT economics professor and physician Jeffrey Harris, points to a parallel between high ridership “and the rapid, exponential surge in infections” in the first two weeks of March — when the subways were still packed with up to 5 million riders per day — as well as between turnstile entries and virus hotspots.

“New York City’s multitentacled subway system was a major disseminator — if not the principal transmission vehicle — of coronavirus infection during the initial takeoff of the massive epidemic,” argues Harris, who works as a physician in Massachusetts.

While the study concedes that the data “cannot by itself answer question of causation,” Harris says the conditions of a typical subway car or bus match up with the current understanding of how the virus spreads…

“Social density … was a result of many factors — business, restaurants, bars, Madison Square Garden, sports arenas, concerts, and the things that make New York happen,” Foye said.

New York City is already unique with its level of mass transit use. The large subway system helps people move around in a crowded city where both parking and driving a car can prove difficult.

The contrast to New York City is sprawling suburbia (including within the New York City region – see Levittown). Americans love to drive and the suburbs are built around cars, driving, and covering relatively large distances on a daily basis within a private vehicle.

With Americans already predisposed toward driving if they can, will COVID-19 increase their reluctance to take mass transit? Is driving safer in these times? (Of course, one could look at the number of deaths related to cars – accidents, pedestrians – and argue otherwise.)

New York City is not the only city dependent on subways; numerous large cities around the world need subways to move large numbers of people. Perhaps there will be new health measures in subways and other forms of mass transit moving forward. But, without fundamentally altering such cities and the benefits that come with density, subways cannot be removed or limited on a long-term basis – can they?

Disparities in COVID-19 cases in DuPage County?

As news came out in recent days about disparities in COVID-19 cases and deaths by race in Chicago (and now the AP shows blacks are disproportionately affected in numerous American locations), I wondered how this plays out in DuPage County. The second most populous county in Illinois (after Cook County) has a reputation for wealth, conservative politics, and numerous jobs.

First, looking at COVID-19 cases across DuPage County communities as reported by the DuPage County Health Department on April 8:

DuPageCountyCOVID19casesCommunitiesApr0820

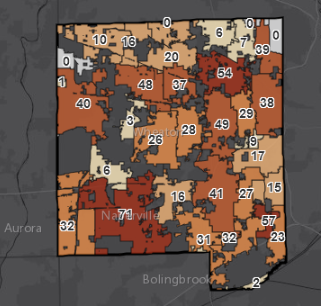
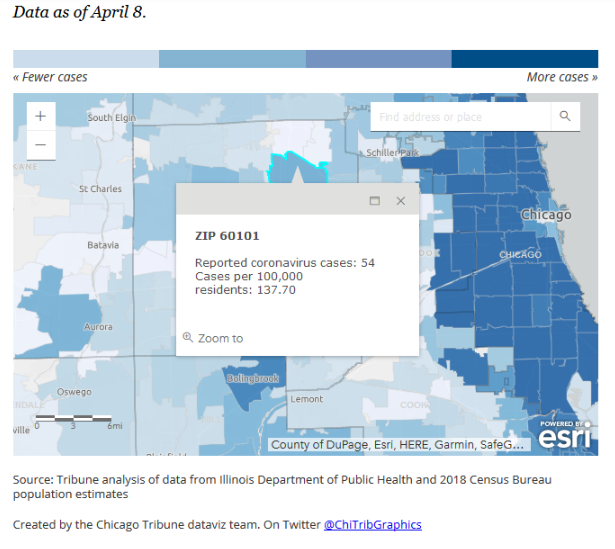
The numbers differ across communities, with some DuPage County municipalities still having no confirmed cases while others have 40+ (and Naperville, the largest community by population in DuPage County, leads the way with 71 cases). But, it would be useful to have rates as the populations differ quite a bit in DuPage County. The Chicago Tribune has an interactive map that shows cases by zip code and also provides rates of COVID-19 cases per 100,000 (but appears to be missing data compared to the DuPage County map). Across the zip codes in DuPage County listed, the rates of cases range from the 50s to the 140s per 100,000. Working with both the absolute numbers and the rates, a few communities stand out: Addison, Lombard, Carol Stream, and West Chicago.

DuPageCountyCOVID19ratesApr0820

DuPage County has a different population composition than Chicago or Cook County. For DuPage County as a whole, 66.3% are white alone (not Hispanic or Latino), 14.5% are Latino, 12.6% Asian, and 5.3% Black.Of course, these demographics can differ pretty dramatically across different communities (Oak Brook looks different than West Chicago which looks different than Glendale Heights). While the reported data does not have a breakdown across racial/ethnic groups (and without this it is impossible to see who has contracted COVID-19 in these communities), some of the higher rates of cases are in communities that are more diverse (Lombard is an exception): Addison is 40.6% Latino (44.7% white not Latino), Carol Stream is 19.3% Asian and 14.9% Latino (and 57.2% white not Latino), and West Chicago is 52.9% Latino (36.5% white not Latino).

Second, addressing age, there are several stories about COVID-19 cases in DuPage County senior homes. The most notable case was a center in Willowbrook (where as of April 7 eight of the county’s 26 deaths had occurred), it also hit a community in Carol Stream, and eight more deaths in the county were attributed to long term care facilities. As of yesterday afternoon, 17 of the 28 COVID-19 deaths in the county occurred among long term care residents.

People 65 years old or older make up 15.5% of the population in DuPage County. Lombard is right at the county average while the other three communities with higher rates are lower than the county average.

Third, all four of the communities with higher rates of COVID-19 cases are below the county median household income. While Lombard is just below the county poverty rate, the other three communities are higher. For DuPage County, the poverty rate is 6.6% and the median household income is $88,711. (A side note on social class: wealthier communities may have fewer households receiving stimulus checks. For example, “About 30% of Naperville households earn too much to COVID-19 stimulus money, study finds.” I imagine there would be similar results in other DuPage County communities with higher incomes.)

More detailed data would obviously enhance our abilities to examine patterns in COVID-19 cases in suburban settings. And the patterns could look different even in the Chicago region: wealthier DuPage and Lake counties might have different patterns compared to other Chicagoland areas. But, I do hope that data does come eventually; while much attention is now focused on big cities, COVID-19 is widespread throughout numerous metropolitan regions, individual suburban governments have limited resources and abilities to tackle the issue, and the risk of contracting and being harmed by COVID-19 could vary quite a bit across suburban residents and businesses.