Reflecting on these large-scale demographic changes, Olivarez says in his forward for Lingering Inland, “Because no one is looking to the Midwest for innovation, it has become an excellent place to experiment. The worst has already happened. Our former industries have collapsed or are on life support. What is there to do but dream a new way of living?”
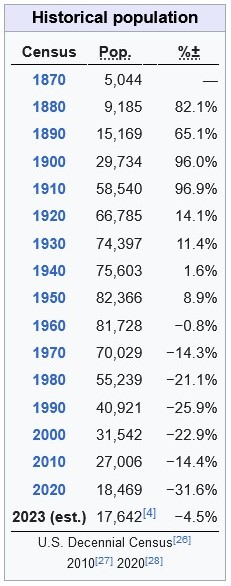
There would be at least a few markers of decline. As noted above, certain industries have declined: steel, the auto industry, manufacturing more broadly. Population growth has slowed or even decreased in some places. The era of newness and rapid growth and status are over: the initial waves of settlement in the 1800s and the residential, commercial, and industrial growth that followed happened decades ago.
The suggestion above is that this history of the Midwest provides space to try new things. Why not see what can be done? Why not envision a new kind of future?
I have not read the forward but I would be interested to hear more. What experiments have been tried in the Midwest? It is made of a number of states and communities; how have they responded similarly and differently to this decline? Have the people and communities of the Midwest found new ways forward or tried approaches that did not work? And what could be done with a past that includes both growth and difficulty?
One possibility in the United States more broadly is that different communities or peoples or states have room to try different approaches. The Midwest has a particular history and is a particular place today. What it could be in the future could be in continuity with its past or go in some new directions, and it could follow those different paths as different regions in the United States have different experiences past and present and chart some different courses.