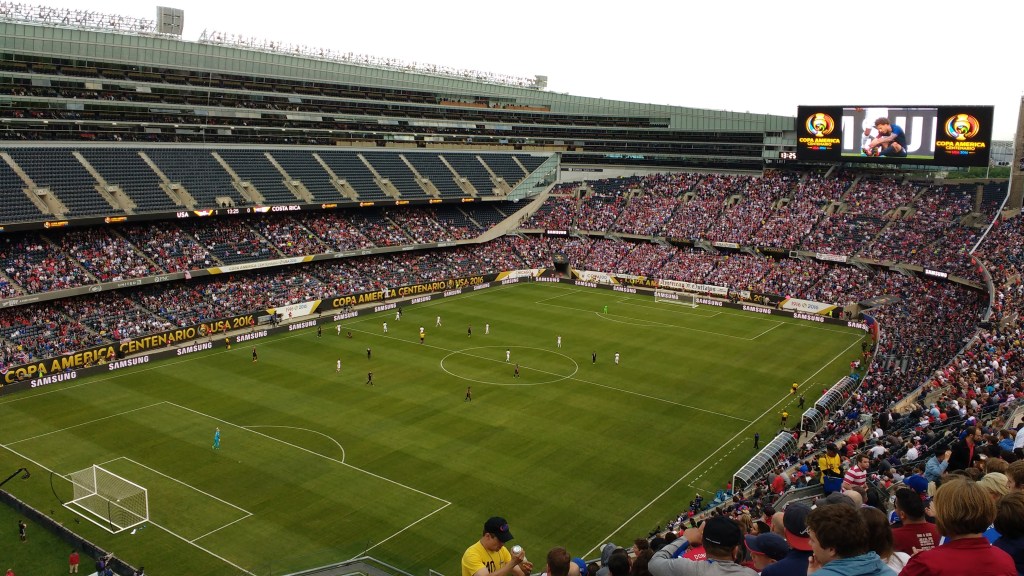
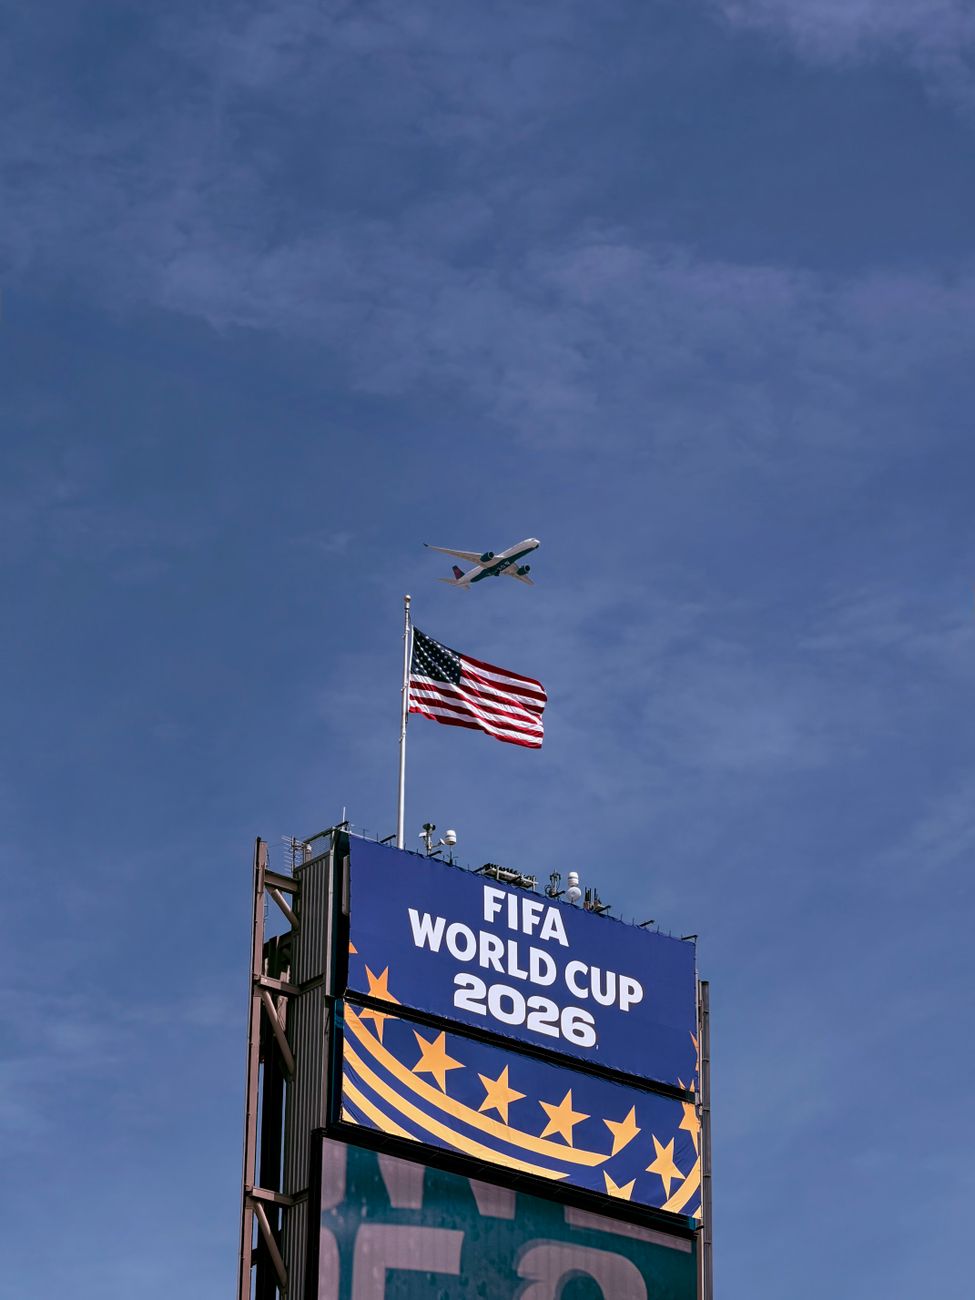
The US men’s soccer team has started out strong at the World Cup. American flags, sing alongs, celebrations of wins. Might their success bring Americans together in a fractured time? A few thoughts:
- Americans like sports, both domestic and international.
- They may like sports but they really like winning at an international level. The Olympics and World Cup are good examples.
- For lots of reasons, the United States is not a world power at soccer – the team is good but not among the best. Do Americans see themselves as an underdog at the World Cup, and, if so, does this help bring people together?
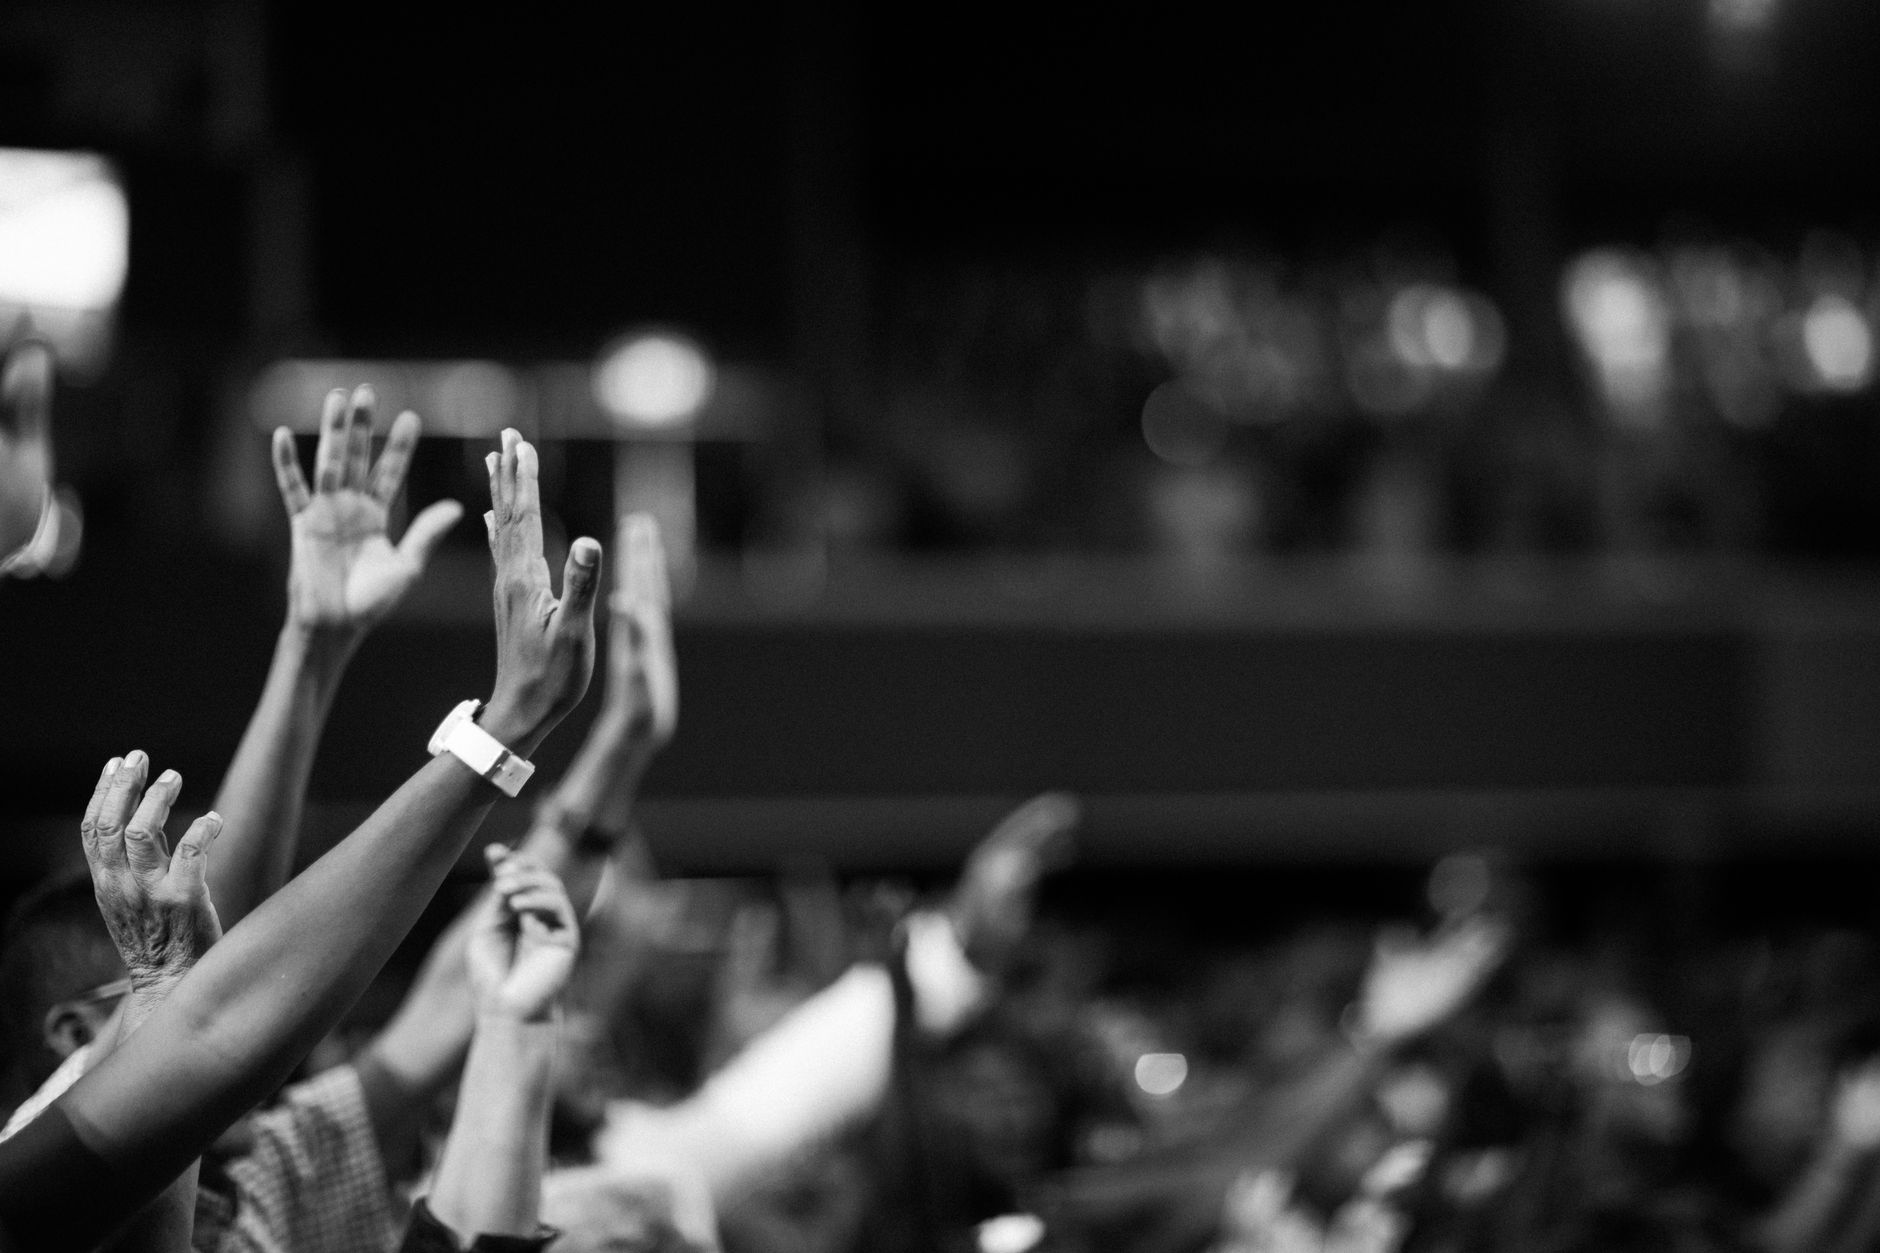
- Does the unity while at a game or watching at the same time continue at all past the event or is it a completely in the moment phenomenon?
- Which Americans tend to follow soccer? How much does this fandom overlap with enjoying the NFL, MLB, or NBA? How does following soccer fit with political affiliations? Is following soccer seen as a repudiation of “typical” American fandom?
- If politics are like sports in certain ways, are sports still more interesting or worthwhile to more Americans (compared to politics)?
What might all these questions lead to? Many may enjoy the World Cup in North America and it could get interesting if the United States makes a deeper run than they have in the past. But conflicts over celebrating July 4th and the leadup to the midterm elections may render any World Cup togetherness a pleasant memory.