Changing political party control at the county level: DuPage County in 2020, the 1930s, and 1856

Voters in DuPage County appear to have supported Democrats more than Republicans at every level in the 2020 election:

Photo by Kelly Lacy on Pexels.com

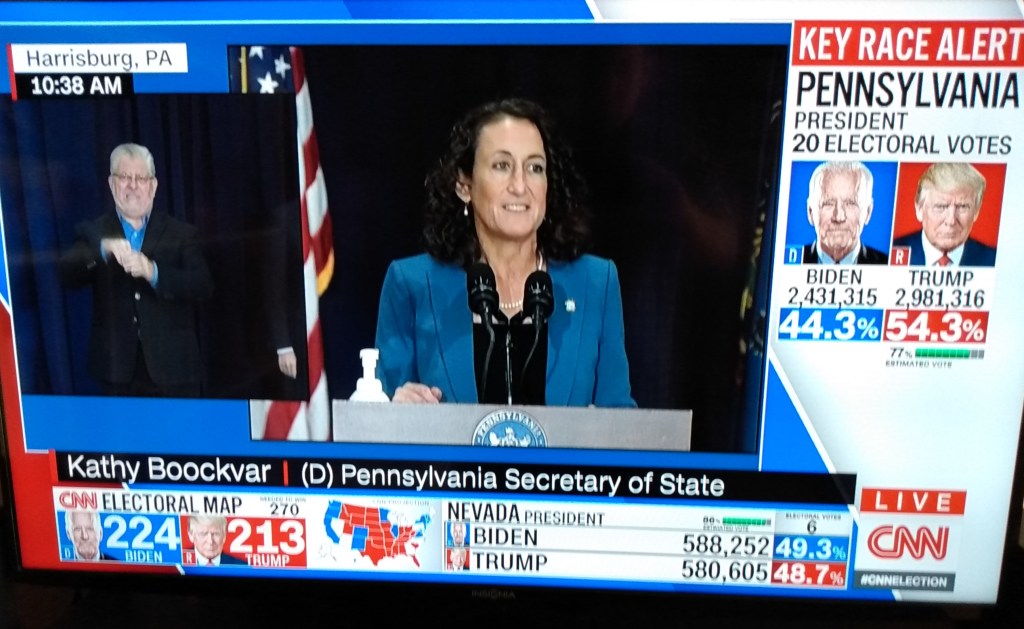
DuPage County, once known as one of the most solidly Republican areas in the country, appears to have given Democrats control of the County Board for the first time since the 1930s. Two more Democrats are leading their races for countywide office, and could be joined by another when the final votes are tallied.

DuPage voters also backed Democrats in every federal race from president to U.S. representative, as well as every state senator and nine of 13 state representatives.

It’s a stunning turn of fortune two decades in the making, observers say, the result of shifting demographics, shrewd campaigning and the divisive reign of President Donald Trump.

The article above tells of recent changes in DuPage County with new residents and a desire for a new party in charge.

But, as the article also notes, this is not the first time such a shift has happened in DuPage County. I do not know much about what happened in the 1930s – I assume the Great Depression and the New Deal were involved – but I have read more about what happened in the 1850s.

In the early decades of DuPage County, which was officially founded in 1839, local political leaders were Democrats. For example, Joseph Naper, founder of Naperville, served in several political positions as a Democrat. Local historian Leone Schmidt details this state of affairs in her 1989 book When the Democrats Ruled DuPage.

This Democrat hold on DuPage politics lasted about two decades. Schmidt concludes her book with the changes that came with the first Republican party candidates in the 1856 elections.

Historian Stephen J. Buck further describes the shift in a 2019 article in the Journal of the Illinois State Historical Society:

In “Free Soil, Free Labor, and Free Men: The Origins of the Republican Party in DuPage County, Illinois,” Stephen Buck synthesizes many of the widely accepted explanations for the Republican Party’s emergence in the 1850s, including the powerful ideal of free-soil in the trans-Mississippi West; opposition to the political clout of the “Slave Power” nationally; and genuine moral commitments to the abolition of Slavery. DuPage County, in Buck’s retelling, serves as a sort of case study in the steady growth of free-soil principles in northern Illinois beginning in the 1840s. Buck finds that by the time of the Lincoln-Douglas debates in 1858, the sectional crisis was so encompassing that it deeply inscribed party identification, even in elections to town and county offices.

This work builds on Buck’s 1992 dissertation where he goes into detail regarding the changes. The issue of slavery and free soil was important in DuPage County and when the Republican Party started in 1854, it quickly attracted support in northern Illinois. In the 1856 elections, Republicans convincingly beat Democrats in local races. And this trend continued in subsequent elections.

Comparing the current shift toward the Democrat party in DuPage County to past shifts, this one seems to be longer in the making. It takes time for suburban populations to change dramatically as different communities attract different residents and national and state politics and forces interact with local conditions. Yet, DuPage residents of the future may well look to the elections of 2016 and 2020 where DuPage turned to the hands of Democrats.

Podcast interview regarding Building Faith: A Sociology of Religious Structures

David Hartman and Brooke Christensen of the More Than This podcast recently talked with sociologist Robert Brenneman and me about our new book Building Faith: A Sociology of Religious Structures. If you are interested in religious buildings and architecture, you will want to listen.

More Than This podcast on Anchor

Suburban shift: 49-45 for Trump in 2016, 51-48 in 2020 for Biden

In 2020, the tight suburban vote swung opposite of 2016 and slightly in favor of Joe Biden:

Photo by Element5 Digital on Pexels.com

While there was much attention paid to late-counted mail ballots in urban areas that put Biden over the top in states such as Michigan, Pennsylvania and Wisconsin, the bigger shift was in the suburbs. In fact, there’s evidence that Trump actually improved his lot slightly in urban areas, which made the suburbs crucial for Biden.

In 2016 exit polls, Trump won the suburbs by four points, 49 to 45. This time, Biden won them 51 to 48 — a seven-point shift in the margin. Biden also joins Obama as the only Democratic presidential candidate to carry the suburbs since 1992, if the exit polls don’t shift from now. The New York Times has a great visualization of the shift from 2016.

Democrats’ suburban edge was also slightly bigger than in the 2018 election in which they won the House, when those areas split about evenly. And given that the suburbs account for about half the votes these days — and growing — Democrats will want to keep that going.

The only problem for them — and it’s a big split between the presidential race and down-ballot — was that this performance didn’t stretch to the conservative-leaning suburban seats Democrats were hoping to take from Republicans. So Democrats need to ask themselves whether this is really about the new reality or whether it was just about Trump, who underperformed his party in many ways, but particularly in these areas.

Two takeaways from these four paragraphs:

  1. The suburbs will continue to be a battleground in presidential, congressional, state, and local races.
  2. There appears to be a shift in 2020 compared to 2016 but this was a relatively minor shift. What happens in subsequent elections will help indicate whether a suburban shift is longer-lasting.

In other words, expect more of the same in 2022 and 2024 with campaigns and pundits focused on suburban locations in the swing states of the 2016 and 2020 elections as well as some other possible locations (like Texas). And county level analysis will be helpful but more fine-grained study will reveal where some of the important divides or pockets of different voters are in sprawling geographic areas.

Getting the categories right in continued urban/rural-plus-suburbs-and-exurbs-in-the-middle divide

Numerous outlets have commented on the continued presence of an urban/rural divide in 2020 voting. Here is another example:

Photo by Pixabay on Pexels.com

Rather than flipping more Obama-Trump counties, Biden instead exceeded previous Democratic win margins in Wisconsin’s two biggest cities, Milwaukee and Madison.

That pattern extended to Michigan and other battleground states, with Biden building upon Democrats’ dominance in urban and suburban jurisdictions but Trump leaving most of exurban and rural America awash in red.

The urban-rural divide illustrates the pronounced polarization evident in preliminary 2020 election results. The split underscores fundamental disagreements among Americans about how to control the coronavirus pandemic or whether to even try; how to revitalize the economy and restore jobs; how to combat climate change or whether it is an emergency at all; and the roles of morality, empathy and the rule of law in the body politic.

Four thoughts in reaction to this.

  1. The urban/rural divide is described in an interesting way above: it is cities and suburbs for Democrats and exurbs and rural areas for Republicans. This matches the patterns of this and recent elections. However, is separating the suburbs and exurbs worthwhile? Here is where county level analysis may not be fine-grained enough to see the patterns. Another way to put it might be this: there is a gradient in voting by party as the distance from the big city increases. Does it shade over to Republicans only in exurbs – which are suburbs on the outer edges? Is the 50/50 split a little before exurbs? A concentric circles approach could help though there still could be pockets that break with the overall pattern.
  2. Suburbs might just be too broad of a term to be useful in such analysis. The exurb/suburb split it one way to put it. Might it help to also think of different types of suburbs (wealthier bedroom communities, ethnoburbs/majority-minority communities, working-class suburbs, industrial suburbs, etc.)?
  3. Explaining the differences as urban/rural has a nice short ring to it and it fits the data. Introducing more categories in the middle is interesting to campaigns, pundits, and researchers but is harder to quickly describe. Perhaps the urban/suburban versus exurban/rural divide?
  4. Is the urban/rural divide one of the most fundamental aspects of polarization? Or, is it a symptom? In this story, the divide leads off the discussion of polarization on a number of fronts. But, what leads to these spatial patterns in the first place? While the geography is helpful to think about, are the real issues behind the urban/rural divide about race/ethnicity and class? Given residential segregation patterns in the United States, using the spatial patterns as an explanation covers up a lot of important social forces that led to those patterns in the first place.

64% of Americans “say social media have a mostly negative effect on the way things are going in the country” – but does this mean individual users will leave?

Pew Research recently released a new report on how Americans view social media’s effects on the country and politics. Here is one of the takeaways from the report:

This chart moves beyond many of the other takeaways which suggest majorities of Americans are skeptical about the intertwining of social media companies and politics. The responses to this particular question suggests the effect of social media is beyond politics: it affects “the way things are going in the country today.”

Since the other questions are about politics and government regulation, it is a little hard to know exactly what this means. Is it bad for young people? Families? Communities? Education? Public spaces? Physical health? It takes up a lot of time? Social media is too powerful compared to other institutions that should be leading the way?

All of these could be very interesting to explore. But, it is also worth examining how this question about social media and the direction of the country is related to the social media use of individual users. Does this mean that more people are not participating in social media? Are accounts being deactivated or deleted? Are people curtailing their time on social media? Is there interest in and movement toward more conversation outside of social media?

One finding of research I have conducted with sociologist Peter Mundey is that young adult social media users can articulate some of the problems with social media. And they modify their social media behavior to try to avoid negative interactions.

But, this does not necessarily mean that they drop out of social media or do not join in the first place. These young adults could also explain the advantages of social media, particularly the ability to maintain connections with people. Some of the connections may not always require effort but they are available. Other connections, say with family and close friends, are worth engaging in through social media. Plus, if they are not on social media, they might be missing out on social connections and events that are hard to access in other ways.

This might lead to a bit of an impasse. Americans think social media and politics is not a good mix. Social media could be bad for the country. But, withdrawing completely from social media might be a lot to ask. In many ways, it could work for individuals, particularly through providing connections to people and information.

Perhaps individual users will continue try to find ways to do both: engage with social media on a limited or focused basis. Or, avoid politics on social media. Maximize the good portions, minimize the negatives. Participate at arm’s length.

Only time will tell. Social media has had a meteoric rise but it is not guaranteed to last. Social media platforms can evolve. New opportunities can arise and social conditions are dynamic. We need to continue to look at how users engage social media. And if we see a steady trend of users leaving social media platforms, that will be worth noting.

First exit poll I have seen on suburban voters

In reporting exit polls yesterday, the New York Times included votes for Biden or Trump by location:

https://www.nytimes.com/interactive/2020/11/03/us/elections/exit-polls-president.html

The 2020 election, according to many pundits, was going to be decided by suburban voters.

The data above appears to follow the patterns from the last few elections. Cities go for Democrats. Rural areas and exurbs go for Republicans. The suburbs are contested ground. The splits are bigger in the table above: 9% advantage for Trump in small city or rural areas, 23% advantage for Biden in cities. And the suburbs are close with just a 3% gap.

Going even further, the suburbs of the true battleground states may be home to the truly important voters. In this election, the residents outside Atlanta, Charlotte, Raleigh-Durham, Cleveland, Columbus, Cincinnati, Pittsburgh, Philadelphia, Detroit, Grand Rapids, Milwaukee, Minneapolis, Phoenix and more might have just decided the election. That national 3% difference might not seem like much but it could matter a lot when state races are tight.

I am sure there will be more fine-grained analysis of the suburban vote by itself as well in comparisons to other demographic factors that influenced vote totals. But, this early data seems to suggest suburban voters will continue to be important in coming elections.

Trying to fit all the election results on one television screen

I watched briefly a number of election night broadcasts last night. One conclusion I came to: there is way too much data to fit on a television screen. And if you want more of the data, you need the Internet, not television.

The different broadcasts tried similar variations: flipping back and forth between a set of anchors and pundits at desks and analysts at a smart board showing election results from different states and locations. They have done this for enough election nights that the process is pretty established.

While they do this, there is often a lot of data on the screen. This could include: a map of the United States with states shaded; a chryon at the bottom with scrolling news; another panel at the bottom flipping through results from different races; and people talking, sometimes in connection to the data on the screen and sometimes. If the analyst at the smart board is on the screen, there is another set of maps to consider.

CNN broadcast, November 4, 2020

This is a lot to take in and it might not be enough. The broadcasts try to balance all of the levels of government – from the presidential race to congressional districts – and are flipping back and forth. I appreciated seeing the more simple approach of PBS which went with a lot less data on the screen, bigger images of the talking heads, and simple summary graphics of the winners.

But, if you want the data, the television broadcast does not cut it. Numerous websites offered single pages where one could monitor all of the major races in real-time. Want to keep up on both local and national races? Have two pages open. Want reaction? Add social media in a third window. Use multiple Internet-connected devices including smartphones, tablets, and computers (and maybe Internet-enabled televisions).

Furthermore, web pages give users more control over the data they are seeing. Take the final 2020 election forecast from FiveThirtyEight:

On one page, readers could see multiple presentations of data plus explanations. Want to scroll through in 10 seconds and see the headlines? Fine. Want to spend 5 minutes analyzing the various graphics? That works. Want to click on all the links for the metholodogy and commentary? A reader could do that too.

The one big advantage television offers is that it offers commentary and faces in real-time plus the potential for live coverage from the scene (such as images of gatherings for candidates) and feeling like the viewer is present when major announcements are made. The Internet has approximations of this – lively social media accounts, live blogs – but it is not the same feeling. (Of course, when you have more than ten live election night broadcasts available on your television, the audience will be pretty split there as well.) Elections are not just about data for many; they also include emotions, presence, and the potential for important memories.

Given these differences in media, I did what I am guessing many did last night: I consumed both television and Internet/social media coverage. Neither are perfect for the task. I had to go to sleep eventually. And whoever can figure out how to combine the best elements of both for election nights may do very well for themselves.

Roughly 3,500 churches close each year; the fate of all their buildings is unknown

In profiling religious buildings that are repurposed into new and unusual spaces, a New York Times story highlights how many potential religious buildings could be repurposed:

A church turned real estate office in Orland Park, Illinois. Image from Google Street View, August 2018.

But not every flock-less church faces an afterlife as living spaces stuffed full of “exceptional quirks around every corner” for hipsters. Many have become different kinds of creative spaces and communal gathering spots, often providing what might be considered “secular ministry.”

It is unclear how many religious buildings are repurposed. Roughly 1 percent of the nation’s 350,000 congregations — or 3,500 — close each year, based on an analysis from Mark Chaves, a sociology professor at Duke University and director of the National Congregations Study. But not all find new uses and some buildings are filled by different congregations.

The eight subsequent profiles of transformed religious spaces are indeed interesting. And this follows a pattern of news reporting on these conversions: look what cool spaces can be created from church buildings! (See earlier blog posts on converting churches to residences here and here.)

Yet, the paragraphs cited above from the beginning of the story note the need to study the full story of religious buildings. What happens to all the buildings associated with congregations that close? A few guesses based on the research Robert Brenneman and I did in our book Building Faith:

  1. Many of these buildings are reused by other religious groups. These can sometimes be groups in the same religious traditions and other times not. A number of congregations are willing to use an existing religious building and then modify it to their own purposes. This might provide a unique opportunity to acquire a building or location for a cheaper price and/or borrow the tradition in an older structure.
  2. Some religious buildings are converted into other uses. I would guess that the percent of all sold or abandoned religious buildings converted into cool uses – ones that become architectural marvels for other uses or feature the kind of activity to be featured in a newspaper – is relatively low.
  3. Some of these church buildings are eventually torn down. It can be expensive to maintain aging structures. It can be costly to convert old structures. The land may be too valuable to be taken up by a religious building. The building might be in a neighborhood or community with limited resources or declining fortunes.

If the buildings are indeed repurposed, the new owners may or may not keep some of the original features. It is hard to tell exactly from the images with the New York Times story but it looks most of these conversions tried to keep some of the church-specific features like stained glass windows, organs, lighting, and ceilings. This may not be desirable for all uses or even for religious groups reusing the building.

Fighting over the fate of Scabby the Rat

Reportedly, the National Relations Labor Board (NRLB) is working to trap Scabby for good:

https://en.wikipedia.org/wiki/Inflatable_rat

Scabby is a giant inflatable rodent, up to 25 feet tall, with angry red eyes, exceptionally prominent front teeth and sharp claws. Created some 30 years ago in Chicago, it’s a favorite device of unions trying to draw attention to their grievances, and it works. “Before, you could drive by and see six guys with picket signs and probably never notice them,” James Allen, president of District Council 1 of the International Union of Bricklayers, told the Tribune last year. Scabby is harder to miss…

But the NLRB’s general counsel, appointed by Donald Trump, is not smiling. Peter Robb, previously a management lawyer, “hates the rat,” one unidentified senior NRLB official told Bloomberg Law. At his direction, the agency is trying to eradicate Scabby.

The effort isn’t likely to succeed. Under Barack Obama, the NLRB ruled that putting this huge air-filled mascot outside the entrance of a hospital, accompanied by a union member holding a leaflet, was a form of free expression protected by the First Amendment…

“The rat balloon itself was symbolic speech,” said the board. “It certainly drew attention to the union’s grievance and cast aspersions on (the nonunion employer), but we perceive nothing in the location, size or features of the balloon that were likely to frighten those entering the hospital, disturb patients or their families, or otherwise interfere with the business of the hospital.”

Read a little more on how Scabby was developed in the Chicago area in this 2018 blog post.

Having seen Scabby in action several times, there at least three reasons the symbol works:

  1. No one wants to be associated with a rat. Even if there are people who like rats as pets, they are not viewed as cuddly or likeable creatures in the same way that many others animals are. A rat is a negative symbol, a reminder of urban squalor or dishonorable behavior.
  2. The size of Scabby and the particular look is not pleasant. This is not just a rat on a sign that is a cartoonish figure; this is a large inflatable that towers over the sidewalk. The eyes are red, teeth are showing, front legs are out. This is not a pleasant figure to look at.
  3. Putting #1 and #2 together, organizations or employers would not like the connotation of the inflatable rat nor the presence of it in front of what they hope to present as a welcoming or pleasant place of business or activity.

This means Scabby could help attract attention to a labor cause. As noted in the story above, it is a visceral image that grabs the attention of people passing by. Without such a large symbol, it could take a lot more work to garner attention including larger pickets or significant media attention. Whether the prolonged presence of Scabby leads to a better outcome for the union or employees is another matter.

Example of rent drop in San Francisco: one bedroom down from $4,300 to $3,150

After hearing of rent drops in Manhattan, I read about one example of rent dropping in San Francisco:

Until the pandemic hit, the city’s housing market was so tight that would-be renters lined up for viewings and arrived with thousands of dollars in cash, ready to sign a lease on the spot.

But now landlords are hard-up for tenants and some are offering several months free, said Coldwell Banker realtor Nick Chen, who recently rented out a one-bedroom for $3,150 that before would have easily gone for $4,300.

“San Francisco rents have been really inflated over the past couple years,” Chen said. “It will come back, but I think the question is: Will it come back to the level it was at previously? Maybe not.”

This is a sizable drop in rent, roughly 25% in a short time frame. Yet, that is still a price that few Americans across the country could meet. Even with significant changes in social life in cities like San Francisco and New York, this does not mean these places are now accessible to many.

Presumably, there is a bottom floor below which rents will not drop. The person who owns the property has their own bills to pay. Some people will see this as an opportunity to get a place in San Francisco at a lower rent and jump at lower prices.

Or, does COVID-19 shift housing prices in high-priced markets for a longer time? If businesses decide to continue work from home and employees are skittish about being around a lot of people in a dense city, do rents drop even further? Is there an opportunity for developers, buildings owners, housing groups, and local governments to jump in and acquire and/or offer cheaper housing? I would not guess expensive housing markets like San Francisco, Seattle, or Manhattan will soon become reasonable but perhaps there will be some opportunities for more people in the region to take advantage.