A recent article discusses the potential workers in the Chicago region and how hard they work:
“Probably the strongest work ethic of laborers is the folks in the Midwest,” the Houston-based founder of SparrowHawk Real Estate Strategists said, definitely not rhyming. “They’re just, I don’t know what they put in the water there, but they’re hard workers. And so you’ve got a good labor force.”…
Illinois Manufacturing Association president and CEO Mark Denzler recalls a businesswoman who recently moved her small manufacturing operations of about 50-70 workers to Mississippi with the goal of saving on costs. She regrets the decision, he said…
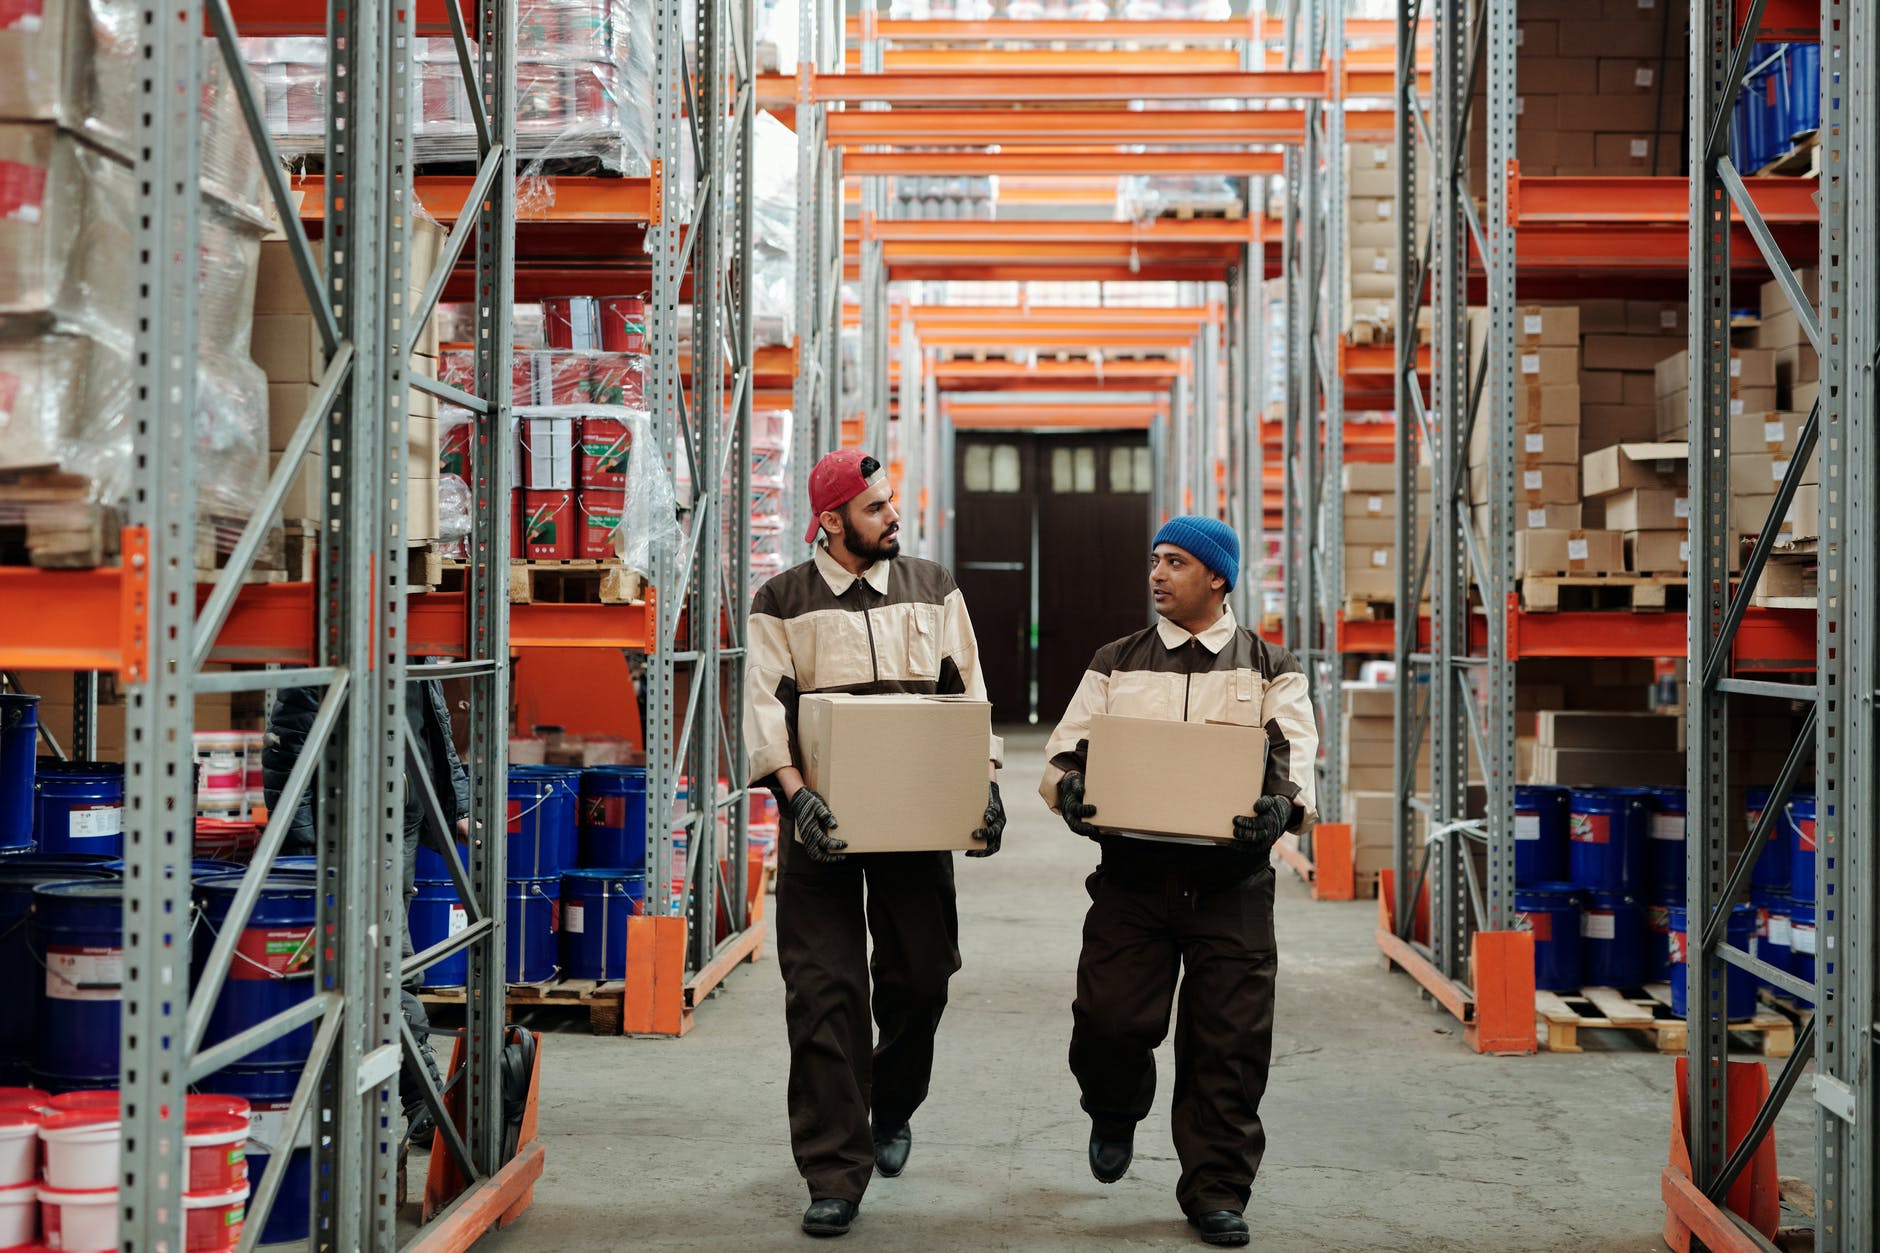
“When I’m around the warehouse workers in the Midwest — Chicago and all these other Midwestern cities — they’re different than the folks in the southeast and the folks in the West Coast. They just have a different work ethic,” he said…
“It would be really hard. I’d be suspicious of anybody who said they can do it,” Bruno said. “But there is this strong experience with work in the Midwest that it’s part of your development. It’s connected to your health and well-being.”
Contrary to the final paragraph above, I bet this could be measured. But, what would it show? And how would workers in Boston or New York City or Atlanta or San Francisco respond to the argument that Chicago workers have a stronger work ethic? Or, within the Midwest and Rust Belt, how about workers in Milwaukee, Cleveland, or Pittsburgh?
This is part of a bigger narrative about Chicago. it is part of its character. Even as it is a global city with an important finance sector and many professional and white-collar workers, it imagines itself as a blue-collar city relying on manufacturing. The loss of manufacturing jobs in the last sixty years hit Chicago hard, as it did many cities, yet the narrative continues.
I would be interested in a more recent study that looks at how residents of the Chicago area think about the purported work ethic. Does the narrative hold across locations, groups, and occupations? Does the idea of “the city that works” extend throughout the region and different kinds of workers?