Comparing neighborhood partisan segregation to workplace partisan segregation

The findings of a new study regarding political sorting in American workplaces can be compared to findings about political sorting in neighborhoods:

Photo by Element5 Digital on Pexels.com

Demsas: How does this compare to the level of partisan segregation that we observe in other places? We know, for instance, that there’s partisan segregation happening in schools or in dating markets and churches and stuff like that. Is the workplace the most segregated based on party in America, or is this in line with other places?

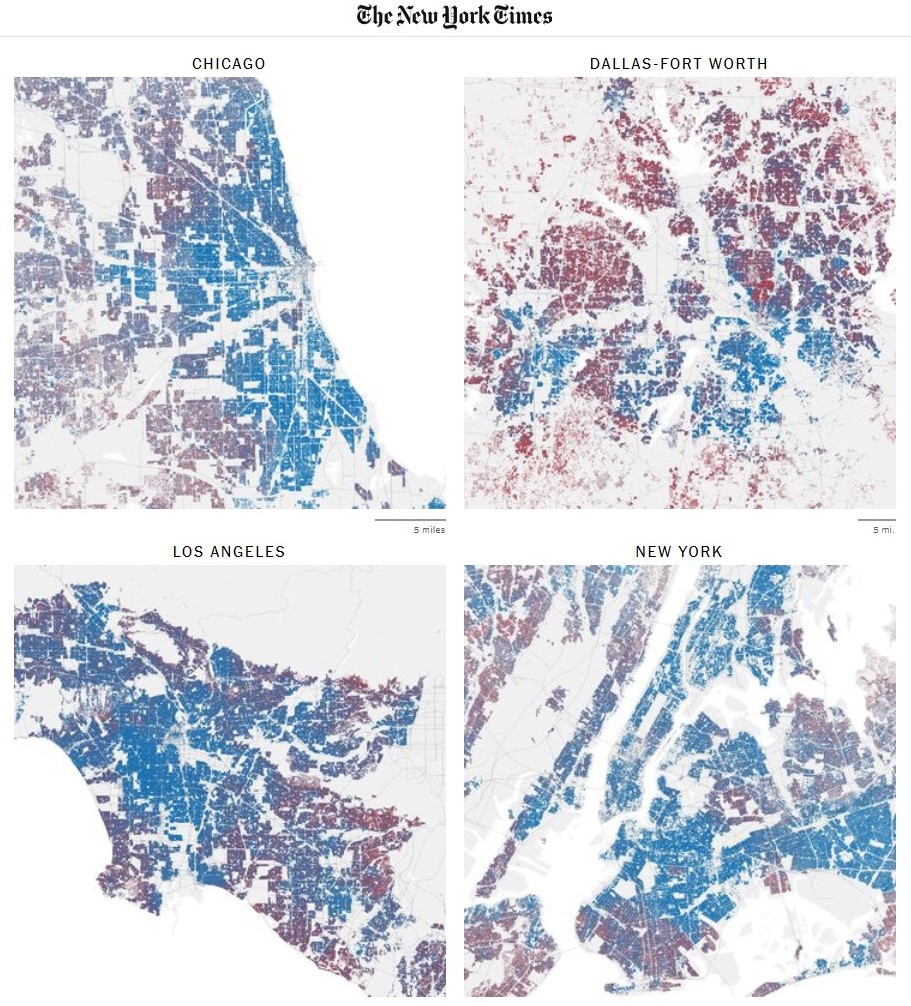
Chinoy: Yeah, so it’s hard to answer this directly for every other social environment or every other group of people. I can tell you a couple things. So one is: I think a natural comparison is residential partisan segregation. This is something that people study a lot, right—the extent to which Democrats live on the same block as Democrats, and Republicans live next to other Republicans. And so we can sort of compare what I told you—that 10 percent number, that overexposure ratio—against partisan segregation across neighborhoods.

And you can define neighborhoods in different ways. One way to do it is a zip code. And when we do that, we find that partisan segregation at work is pretty similar. So, like, a little bit less than but overall pretty similar to partisan segregation across zip codes. We can go one step further and say, you know, maybe the zip code is a little bit bigger than what you have in mind when you think of neighborhood-level sorting. And so we have individual addresses in our data, and so we can say, you know, You have 15 co-workers. Let me figure out how many of them share your party affiliation, and let me look at our sample of the 15 people who live closest to you and figure out how many of those people share your party affiliation.

And when we do that, we find that workplace-level segregation, workplace-level overexposure ratio is a little bit less pronounced than that sort of nearest neighbor level of segregation, but still pretty similar, not so different. It’s not orders of magnitude different. So that’s kind of why we say that it’s a little less pronounced than residential segregation as a whole but still pretty sizable.

It sounds like the levels of political sorting are similar: what people tend to experience where they live is similar to what they experience at work.

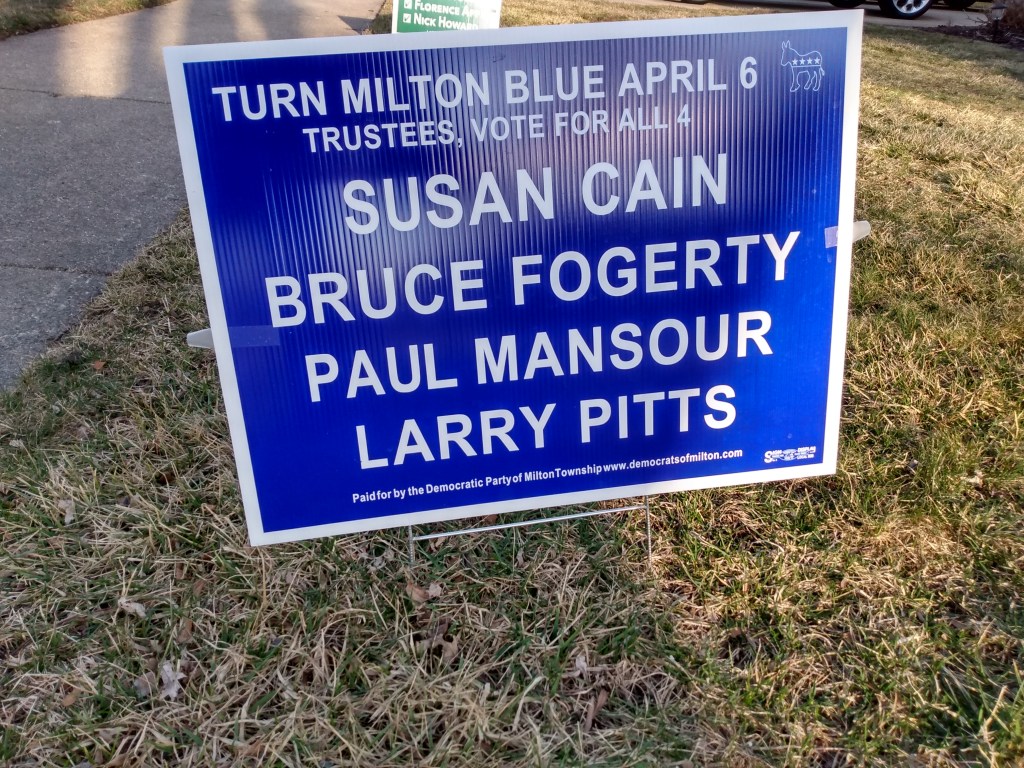
I wonder how much it is experienced differently at work compared to a neighborhood. Where are politics more visible? In a neighborhood, a resident may have different indicators of political affiliation. It could come through conversation or yard signs or particular behaviors. At work, people might interact with each other or be in physical proximity more. Would political ties then be more apparent through conversation? Or are people sharing other signs of political leanings (things at a desk/cubicle/office, etc.)? Across both settings, are political views most visible on social media or online activity? Are people more comfortable with partisan sorting with neighbors or coworkers?

The bipartisan coalition that keeps funneling money to highways and roads

Americans like highways and driving. The construction and maintenance of roads is often supported across the political spectrum:

Photo by Antonio Avanti on Pexels.com

Even in deep-blue states, a bipartisan coalition keeps the highway funding spigot open, said Amy Lee, a postdoc at the University of California, Los Angeles who wrote her dissertation about California’s failure to constrain highway growth. “The construction-materials companies tend to be very big on the right, and organized labor tends to be very powerful on the left,” she said, and these forces form a pro-highway juggernaut. In January, a coalition of construction companies and labor groups sent a letter to California’s top elected leaders defending “funding for infrastructure projects that may potentially increase vehicle miles traveled”—i.e., highway expansions. (The Laborers’ International Union of North America did not respond to repeated requests for comment for this article.) As with electric vehicles, highway construction seems to be a topic in which environmental and union interests diverge.

Transportation departments don’t want to hear no on highways. In 2022 Oklahoma’s department of transportation preemptively bought 23 web domains, like oklahomansagainstturnpikes.com and stoptheeasternloop.com, that could theoretically be used to rally opposition to the state’s $5 billion highway plan. Speaking up against pavement within a department can be difficult and risky. Last year, Jeanie Ward-Waller, a Massachusetts Institute of Technology–trained engineer who served as the deputy director of planning and modal programs for California’s Caltrans, was demoted after questioning her agency’s plans to widen I-80 between Sacramento and Davis. In an editorial published in the San Francisco Chronicle, Ward-Waller wrote, “My concerns were repeatedly brushed off by my bosses, who seemed more concerned about getting the next widening project underway than following the law.”

At the federal level, even asking questions about the collective climate impact of highway building appears verboten. In 2022 Stephanie Pollack, the acting head of the Federal Highway Administration, called on state DOTs to measure the carbon emissions attributable to their highway systems. Republicans were incensed; 21 states filed a suit, and Republican Senate Minority Leader Mitch McConnell advised governors to simply ignore her.

Democrats have supported highway expansions too. The White House called the Bipartisan Infrastructure Law “a critical step towards reaching President Biden’s goal of a net-zero emissions economy by 2050,” but subsequent analysis by Transportation for America found that state DOTs used nearly a quarter of the $270 billion they received through the law to expand highways, a move sure to increase emissions. (After the infrastructure bill was passed, the head of Louisiana’s transportation department said that “some of the winners I think from this project funding will be things like the Inter-City Connector,” referring to the Shreveport project.)

With so many forces pushing for roadway expansions, opposing them requires political bravery.

At this point in American history, highways might seem “inevitable” or “natural.” For decades, highways have helped bring all sorts of features of American society, including big box stores, road trips, and suburban subdivisions.

As noted above, this system requires resources. And both major political parties tend to support it. They might fight particular projects (also highlighted in the article) but they generally find the money needed for fixing roads and creating new ones.

To reverse course then requires a major political change. Resources could be funneled elsewhere. The topic could become a regular campaign issue. It could join with popular support. How might it be pitched? Here are two areas where I could guess these political appeals might work:

  1. The individual costs of driving are high. Paying for gas, insurance, maintenance, storing a vehicle, and more add up. Are all people interested in paying this year after year after year?
  2. A desire among some (not all) for denser living areas that can support less driving. Even American cities can be sprawling but it seems there is some interest for communities that are more walkable and accessible by other means.

There are other arguments to make, of course. The two I listed get at different opportunities people might want. Pivoting from a transportation method that tends to privilege individual choices to travel wherever they want whenever they want might require providing different opportunities.

Suburban voters were split in 2022

As the data trickles out from the midterm elections, here is one summary about how suburbanites voted:

Photo by Anna Shvets on Pexels.com

In 2018, independents went for Democrats 54 percent to 42 percent. Moderates broke for Democrats by a 26-point margin, and the suburbs split. In 2020, according to the national exit poll, independents went for Democrats 54 percent to 41 percent, moderates broke for Democrats by a 30-point margin, and Democrats won the suburbs 50 to 48 percent. Fox had similar results.

This year, independents went for Democrats narrowly. Moderates broke for Democrats by 15 points. And the suburbs narrowly went for Republicans in the national exit poll, while narrowly going for Democrats in the Fox voter analysis. Our national stalemate continued.

In the current state of national politics, both parties want the suburbs to break their way. It appears suburbanites were fairly split this year, meaning that not a whole lot changed. Will either party have a platform or message in 2024 that is more appealing to suburbanites than the other side?

Seeing these results also got me thinking about redistricting, gerrymandering, and how suburban areas are incorporated in districts. Given their volatility and patterns (suburbs closer to big cities lean one way, those on the metropolitan edges lean another way), do party leaders want to consolidate suburban votes or break them up? I would be very interested to see an analysis on this.

UPDATE: In at least one metropolitan region, Democrats continued to make inroads in the suburbs. Referring to DuPage County and the Chicago region as a whole:

The once-impenetrable GOP stronghold was considered purple territory in recent election cycles. But in a watershed moment, Democrats captured the county board chair seat and appeared to hold onto their board majority Tuesday.

The shift in DuPage is part of a political evolution in suburban areas. Four years after Democrats made significant gains in the region, several of the collar counties turned a darker shade of blue on Tuesday.

Democrats flipped key state House districts in the Northwest suburbs. They solidified control of the Lake County Board. The GOP has no representation in Congress from northeastern Illinois. And in DuPage, Democratic state Rep. Deb Conroy became the first woman elected county board chair.

As noted in the article, this is a significant change over the course of several decades.

Reasons for suburban legislators leading the Illinois Democrats

As American political divides currently sit in the suburbs, the tension between Chicago Democrats and suburban Democrats in Illinois is interesting to consider:

Photo by Kelly Lacy on Pexels.com

In adding suburbia to the Democratic base, it turned out, Madigan also created a party that would no longer tolerate his Chicago ward boss style of leadership.

“Suburbanites tend to be less enamored of machine politics,” said Christopher Z. Mooney, a professor of political science at the University of Illinois-Chicago. “Machine politics is about one thing: getting jobs. Suburban voters tend to be more concerned about corruption. They’re a little better off,” and thus don’t need the government jobs political bosses can dole out…

While many suburban representatives had benefited from Madigan’s operation, the ComEd scandal marked the moment that “a limit had been reached,” Mooney said. “They felt that his usefulness was over. The fact that they were from the suburbs allowed them to have some cover. Madigan’s political tentacles are more effective in the city of Chicago or Cook County.”…

Suburbanites haven’t just changed the way politics is conducted within the Democratic Party, they’ve also made certain issues more important to the party. Abortion, for instance. In the 1980s, the Catholic Madigan declared himself “100% pro-life.” In 2019, he supported the Reproductive Health Act, which ensured that abortion will be legal in Illinois if Roe v. Wade is overturned, and declares that a “fetus does not have independent rights under the laws of this state.”

The explanations here suggest the changes in suburbs have had significant consequences for politics. As noted above, corruption turns off suburban voters – who often like the idea of more virtuous smaller local government – and there are more pro-choice suburban voters.

I could imagine several other factors involving suburbia that have influenced this change:

  1. The increasing suburban population compared to the population of Chicago. As a proportion of Illinois residents, there are more suburbanites than in the past. This does not necessarily guarantee changes toward what suburbanites want but it could be a factor.
  2. The suburbs have changed in demographic composition. There are now different kinds of suburban residents, including more racial and ethnic minorities and more lower-income residents. The whiter and wealthier suburbs still exist in places but so does more complex suburbia. The suburban voters today are not just more educated whites.
  3. While the comparison above is between Chicago style politics and suburban politics, I wonder how suburbanites view the big city more broadly as compared to the past. Are more suburbanites interested in life in denser communities with more cultural opportunities (even if they are in the suburbs)? How essential is Chicago to the region and state compared to all of the activity – business, cultural, civically – in the suburbs?

Searching for the perfect name for a slate of candidates in local elections

Keeping in mind regulations, non-partisan traditions, and what might appeal to voters, candidates running for local elections in the Chicago area come up with some clever names for their slate:

Photo by Element5 Digital on Pexels.com

A court ruled in 2017 that candidates in Illinois don’t need to be part of a slate to run under the banner of a political party. So Dubiel decided to create a party of which he would be the only member — LZ Thrive…

When the calendar turns to the spring municipal elections, political passions are no longer contained to Republicans and Democrats. In suburb after suburb, you’ll find parties with monikers like People Before Politics, We’re in This Together, You Are the Village’s Heart, the Common Sense Again Party, the United Party for Progress or, most expansive of all, the Party of the Past, Present and Future…

One way to avoid such complications is to change the party’s name for every election, thereby making it a brand-new entity that can control its slate. That has been a routine practice in Bolingbrook, which for more than three decades was run by former Mayor Roger Claar under a variety of party names…

Those included Citizens for Bolingbrook First, the Bolingbrook First Party, Bolingbrook First and, in its most recent iteration following Claar’s 2020 retirement, the First Party for Bolingbrook.

I imagine there is an art to this. What exactly can capture a particular local spirit? Many of the names quoted above emphasize a bright future or emphasize a collective community spirit. There is a sense of optimism or forward momentum. (There could be the occasional anti-growth or preserve the community slate names in there as well – just not quoted above.)

If many of these are in the suburbs, other names might fit with the broad themes of suburbia: Making the Best Suburb for Your Children! Boosting Your Property Values! Keeping Certain Land Uses (and People) Out! Maintaining Our Lead Over Other Nearby Suburbs! And so on.

What if this was possible at the national level? What could Democrats and Republicans come up with every two and/or four years to really emphasize their particular focus in that election? Since each party does reconfigure their platform each election to fit current priorities, perhaps this would make some sense. It could also help eliminate the confusion over long-term shifts where one party used to support something but now it is the other party that pushes it.

Residential segregation – by political party

Residential segregation by race is a large issue and voting patterns in recent elections generally show Democrats winning in cities and close suburbs and Republicans winning in outer suburbs and rural areas. Put these two ideas together and you have residential segregation by political party.

https://www.nytimes.com/interactive/2021/03/17/upshot/partisan-segregation-maps.html

As new research has found, it’s not just that many voters live in neighborhoods with few members of the opposite party; it’s that nearly all American voters live in communities where they are less likely to encounter people with opposing politics than we’d expect. That means, for example, that in a neighborhood where Democrats make up 60 percent of the voters, only 50 percent of a Republican’s nearest neighbors might be Democrats.

Democrats and Republicans are effectively segregated from each other, to varying degrees by place, according to the Harvard researchers Jacob Brown and Ryan Enos. And at least over the past decade, they believe this partisan segregation has been growing more pronounced…

For each individual voter, tied to an address, the researchers looked at their thousand nearest voters, weighting those next door more heavily than those a mile away. Drawn this way, about 25 million voters — urban Democrats especially — live in residential circles where at most only one in 10 encounters is likely to be with someone from the opposite party. Democrats in parts of Columbus, Ohio, and Oklahoma City live this way. So do Republicans in the reddest parts of Birmingham, Ala., and Gillette, Wyo…

These studies together suggest that as places become more politically homogeneous, people there are more likely to conform and to publicly signal their partisanship. Maybe no one says, “I want to move here because of all these Biden yard signs.” But perhaps one neighbor is swayed by the people who put them up, and another neighbor concludes, “This isn’t the place for me.”

Lots of confounding variables to examine across a lot of locales. But, the underlying patterns are fascinating to consider: do geographic communities, even in an era of reduced neighborly contact and participation in local institutions, influence people’s political belief and behavior? With more focus in recent years on how online and social media behavior influences politics, this connection to geography has the opportunity to reinvigorate conversation about the power of local communities.

I would be interested to see how this plays out among local governments of communities with similar traits. Take a suburb closer to a big city that leans Democrat and a suburb further out that leans Republicans. Are the local decisions made that different? Do local elections look different?

Or, how often are there tipping points across communities and neighborhoods where a majority of voters are of one party or another? The patterns now show some stability but these have changed in the past and could change again in the future. What happens when they do change and does the character of the community change?

Abolish townships or worry about turning them blue (or keeping them red)?

Illinois has many taxing bodies and government units. Illinois moved to stop creating new government bodies and DuPage County resolved several years ago to work to reduce the number of government bodies. Townships are a common target; they exist above municipal governments and below counties so are they necessary?

I thought of this recently with the lead-up to the upcoming local elections. On one side, I have seen signs urging voters to “Turn Milton Blue.”

This might be a strategy to boost local turnout and connect to broader political patterns. But, I do not know what these candidates want to do at the township level. What significant changes are needed?

On the other hand, I have seen campaign material for Republican candidates for Milton Township. This material listed all the things that the township does, presumably because of the Republicans there. For a party that at least talks sometimes about limited government, should they argue townships are unnecessary rather than fighting for political seats?

More broadly, how much do these township races benefit the people and communities of Illinois? In a time of budget deficits before COVID-19 plus further issues because of COVID-19, is it more important that one party or another holds the majority of seats in townships?

Sociology experiment shows how parties can flip positions

Cass Sunstein describes a sociology study that could help explain how attachment to a political party can lead to divergent political positions:

Here’s how the experiment worked. All participants (consisting of thousands of people) were initially asked whether they identified with Republicans or Democrats. They were then divided into 10 groups. In two of them, participants were asked what they thought about 20 separate issues — without seeing the views of either political party on those issues. This was the “independence condition.” In the eight other groups, participants could see whether Republicans or Democrats were more likely to agree with a position. This was the “influence condition.”

In the influence condition, each participant was asked his own view, which was used to update the relative level of support of each party. That updated level was displayed, in turn, to the next participant in the same group.

The authors carefully selected issues on which people would not be likely to begin with strong convictions along party lines. For example: “Companies should be taxed in the countries where they are headquartered rather than in the countries where their revenues are generated.” And, “The exchange of cryptocurrencies (such as Bitcoin, Ethereum, or Litecoin) should be banned in the United States.” Or this: “Artificial intelligence software should be used to detect online blackmailing on email systems.”

The authors hypothesized that in the influence condition, it would be especially hard to predict where Republicans and Democrats would end up. If the early Republican participants in one group ended up endorsing a position, other Republicans would be more likely to endorse it as well — and Democrats would be more likely to reject it. But if the early Republicans rejected it, other Republicans would reject it as well — and Democrats would endorse it.

And the findings:

Across groups, Democrats and Republicans often flipped positions, depending on what the early voters did. On most of the 20 issues, Democrats supported a position in at least one group but rejected it in at least one other, and the same was true of Republicans. As the researchers put it, “Chance variation in a small number of early movers” can have major effects in tipping large populations — and in getting both Republicans and Democrats to embrace a cluster of views that actually have nothing to do with each other.

This seems like a good reminder regarding humans: attachments to groups are very important. When faced with taking in information, what the groups we identify with matters. This is the case even in an age where we would claim to be individuals.

Studying social change more broadly is a difficult task. It is perhaps easiest to see large-scale change after it has already happened and observers can look back and pick out a path by which society changed. It can be quite hard to see social change as it is occurring when it is unclear what exactly is happening or in which direction a trend line will go. It can also be difficult to see changes that did not take off or trends that did not go very far.

Nixon’s liberal economic policies and other reminders that the major political parties can change

Media discourse about political parties as well as the public pronouncements of politicians tend to reify that certain policy positions are fixed between the two political parties. “Republicans always want to help the wealthy with their tax cuts.” “Democrats always fight for non-white residents.” And so on.

Yet, political parties change positions fairly regularly and often do so for political, rather than ideological, considerations. Here are two examples I found while reading American Sociology: From Pre-Disciplinary to Post-Normal by Stephen Turner.

Nixon proposed such things as minimum income rights and a national health care policy: both were rejected by the Democrats on the grounds that they should be more generous, and in the hope that they would be able to gain power and enact policies more to their liking. In any event, they got neither minimum incomes nor health care guarantees. Ted kennedy, the principal obstacle to the health care compromise offered by Nixon, later regretted his failure to accept it. (p. 55)

And an earlier example:

Race was a problem for reformers: on the one hand they were sympathetic to uplifting the Black masses; on the other they were inclined to regard them as in need of civilizing. The Progressive Party platform makers, including Jane Addams, were persuaded by their presidential candidate Theodore Roosevelt to omit any references to improving the conditions of Blacks, on the ground that this would cost the party politically – this was at a time win which the Republican Party, from which Roosevelt was splitting, was the party of Blacks. (p.24)

It might be easy to write this off as being in the past – anything past even just a few years ago is very difficult to discuss in media settings – but these two examples provide a reminder that political parties can indeed change dramatically. What Democrats and Republicans look like today is not the same as they were decades ago nor will they necessarily be the same ten or twenty years from now.

Gallup CEO criticizes measurement of unemployment in the US

The CEO of Gallup says the current unemployment rate is “a Big Lie” because of how it is calculated:

None of them will tell you this: If you, a family member or anyone is unemployed and has subsequently given up on finding a job — if you are so hopelessly out of work that you’ve stopped looking over the past four weeks — the Department of Labor doesn’t count you as unemployed. That’s right. While you are as unemployed as one can possibly be, and tragically may never find work again, you are not counted in the figure we see relentlessly in the news — currently 5.6%. Right now, as many as 30 million Americans are either out of work or severely underemployed. Trust me, the vast majority of them aren’t throwing parties to toast “falling” unemployment.There’s another reason why the official rate is misleading. Say you’re an out-of-work engineer or healthcare worker or construction worker or retail manager: If you perform a minimum of one hour of work in a week and are paid at least $20 — maybe someone pays you to mow their lawn — you’re not officially counted as unemployed in the much-reported 5.6%. Few Americans know this.

Yet another figure of importance that doesn’t get much press: those working part time but wanting full-time work. If you have a degree in chemistry or math and are working 10 hours part time because it is all you can find — in other words, you are severely underemployed — the government doesn’t count you in the 5.6%. Few Americans know this…

Gallup defines a good job as 30+ hours per week for an organization that provides a regular paycheck. Right now, the U.S. is delivering at a staggeringly low rate of 44%, which is the number of full-time jobs as a percent of the adult population, 18 years and older. We need that to be 50% and a bare minimum of 10 million new, good jobs to replenish America’s middle class.

How an official statistic is measured may seem mundane but it can be quite consequential, as is noted here. What exactly does it take to get a government agency to measure and report data differently?

This critique may make some interesting political bedfellows. Conservatives might jump on this in order to show that the current administration hasn’t made the kind of economic progress they claim. Liberals might also like this because it suggests a lot of Americans still aren’t doing well even as big corporations and Wall Street seem to have profited. Neither political party really wants to take on Wall Street so they might support these numbers so stocks keep moving up.