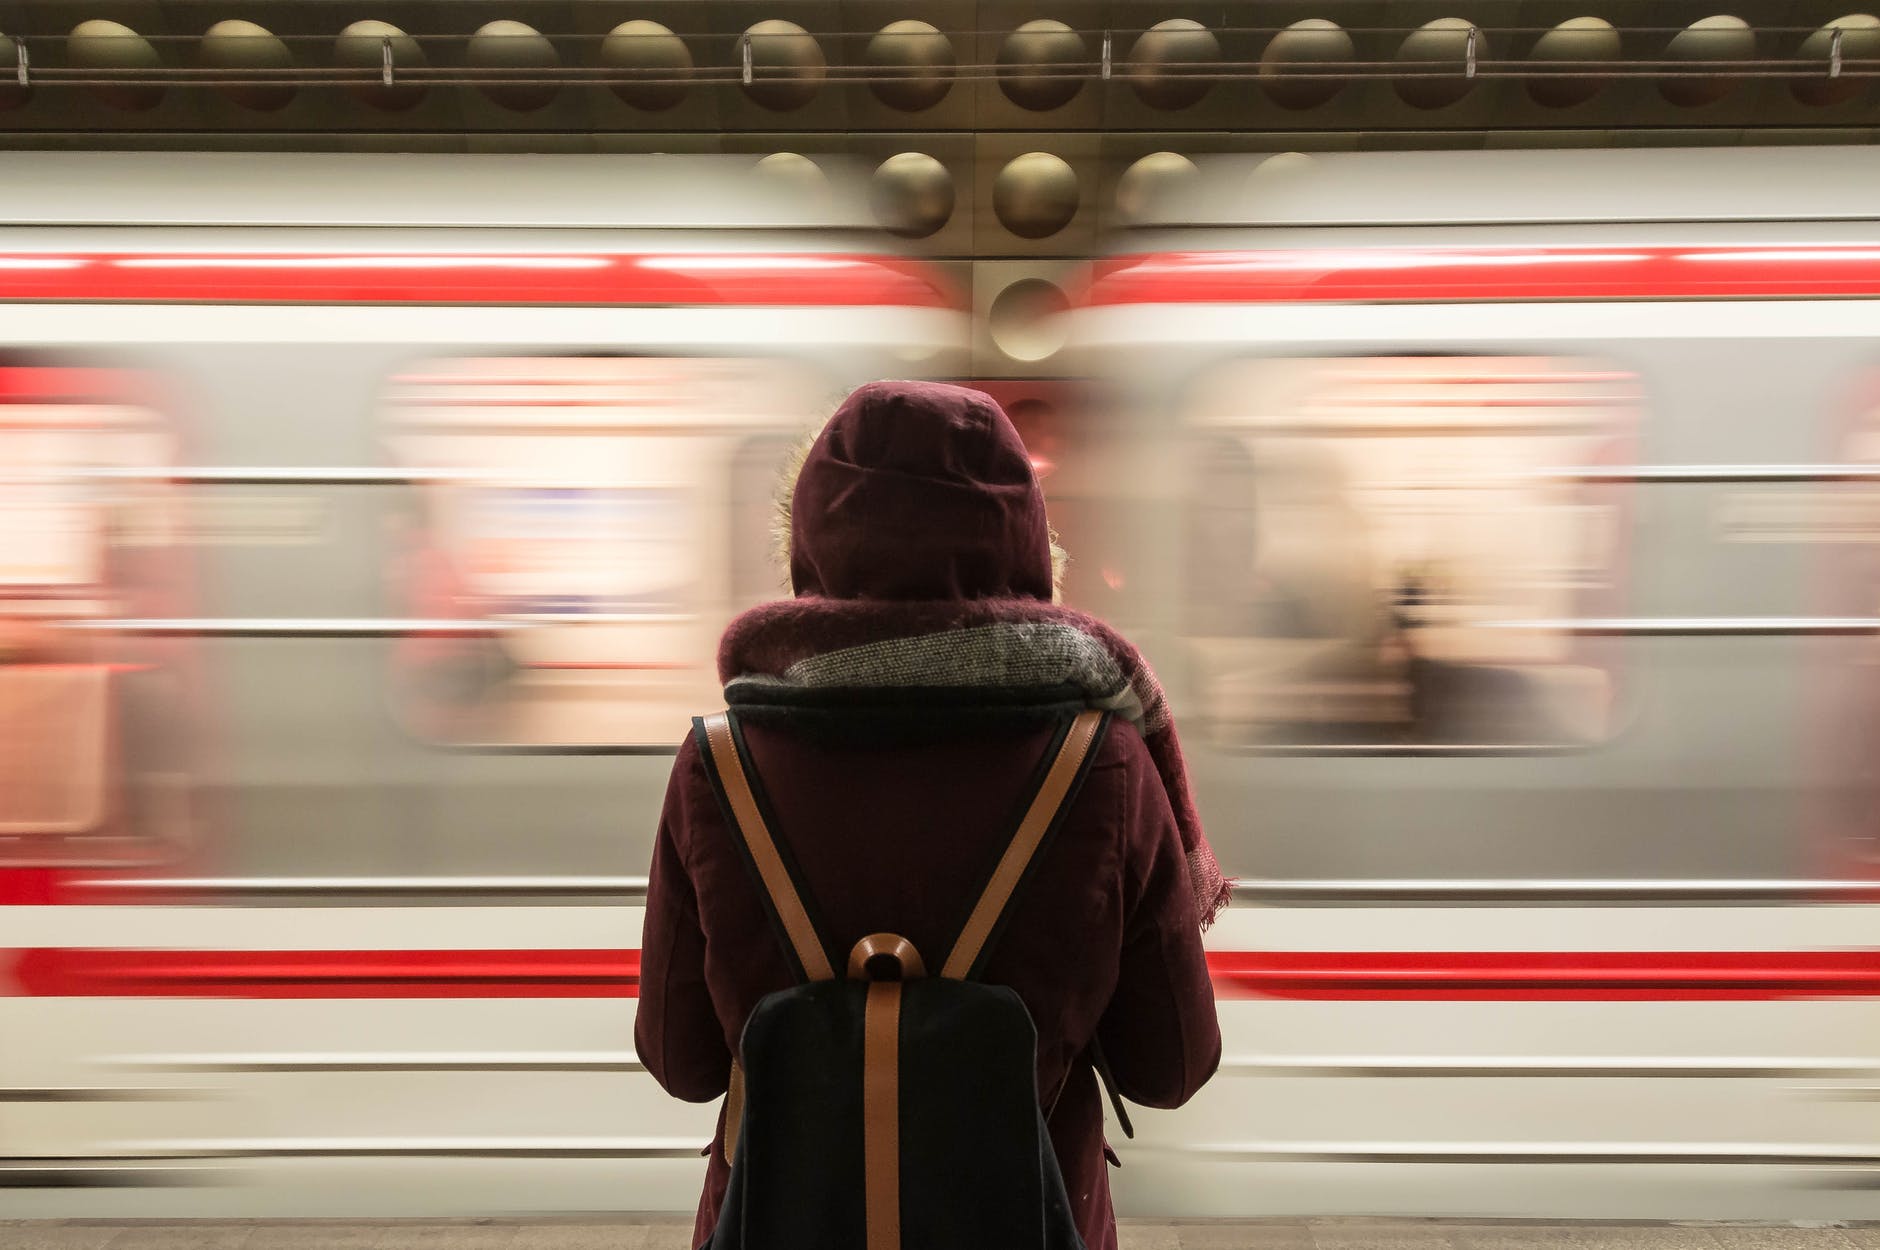
COVID-19 has disrupted the work patterns of many and this included the commute to and from work. Even as some relished the opportunity to work from home and avoid the time and hassle of a commute, the pattern could offer some advantages. Enter in alternative rituals to mark the beginning and end of a work day:
I sought the advice of Ezra Bookman, a corporate-ritual designer (yes, this is a real job) based in Brooklyn. His work includes coming up with ideas like “funerals” for failed projects. “Every single conversation I have with corporate clients is the same,” he told me: “Employees are burnt out and have no separation between home and life.”
Naturally, he has come up with some rituals to replace the commute and mark the beginning and end of each day. The ideas he’s proposed to clients include lighting variations, warm-up stretches, cellphone-free walks, and, as he demonstrated to me over Zoom, shrouding your computer in a fine blue cloth when you log off, as if it, too, needs a good night’s sleep.
“Rituals are friction,” he told me. Like the commute, “they slow us down. They’re so antithetical to most of our life, which is all about efficiency and speed.” One ritual that worked for Bookman was changing his laptop password to “DeepBreath”: “It helps me to locate myself in time and say, ‘Okay, what am I here to do?’ ”
Iqbal, the Microsoft researcher, said that this was the same idea behind a “virtual commute” that her company has just released. An onscreen tap on the shoulder—“Ready to leave for the day?”—signals that it’s time to knock off. The shutdown sequence has you bookmark what you were working on. It invites you to “take a minute to breathe and reset,” in sync, if you like, with a calming meditation video. Because work is done.
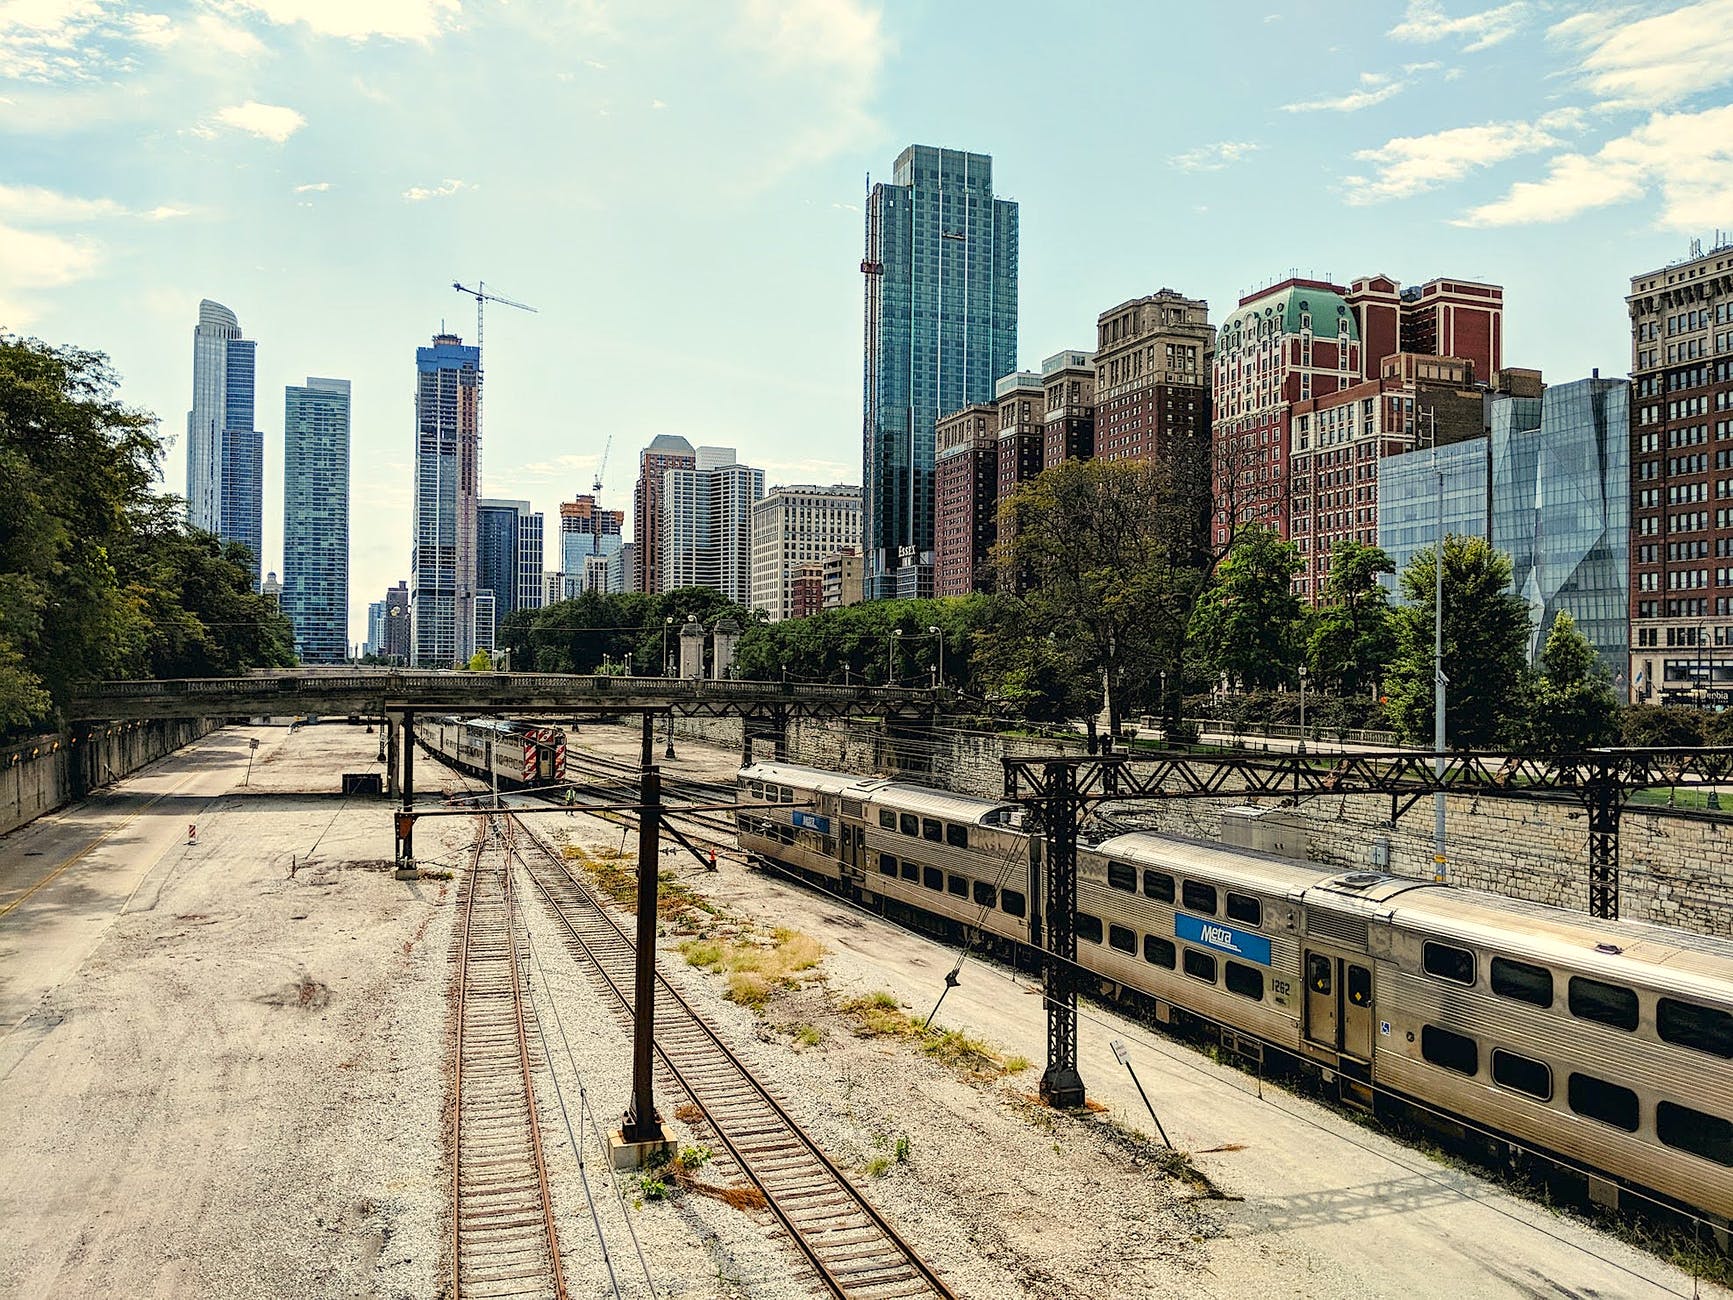
The stark physical distance in the modern world between work and home is one that is relatively unusual in human history. In communities prior to the 1800s, many workers lived and worked in close proximity, often on the same property or land. The availability of new transportation options plus burgeoning populations and industries separated the two such that the physical distance between home and work increased.
These rituals hint at these physical distances while emphasizing the broader dimensions of not living and working in the same place. Humans fall into and often enjoy routines/rituals. Even if they are stressful – and commuting can be both in the moment and long-term – they can become needed.
At the same time, how exactly does replacing one ritual with another work? Here the issue is work and home life, trying to recreate patterns that allow for decompression and shifting focus. Yet, the new ritual is quite different: it does not involve the body in the same way – less motion, more emphasis on breathing – and happens at a different speed – commuting involves the possibility of higher speeds via car, train, and other means.
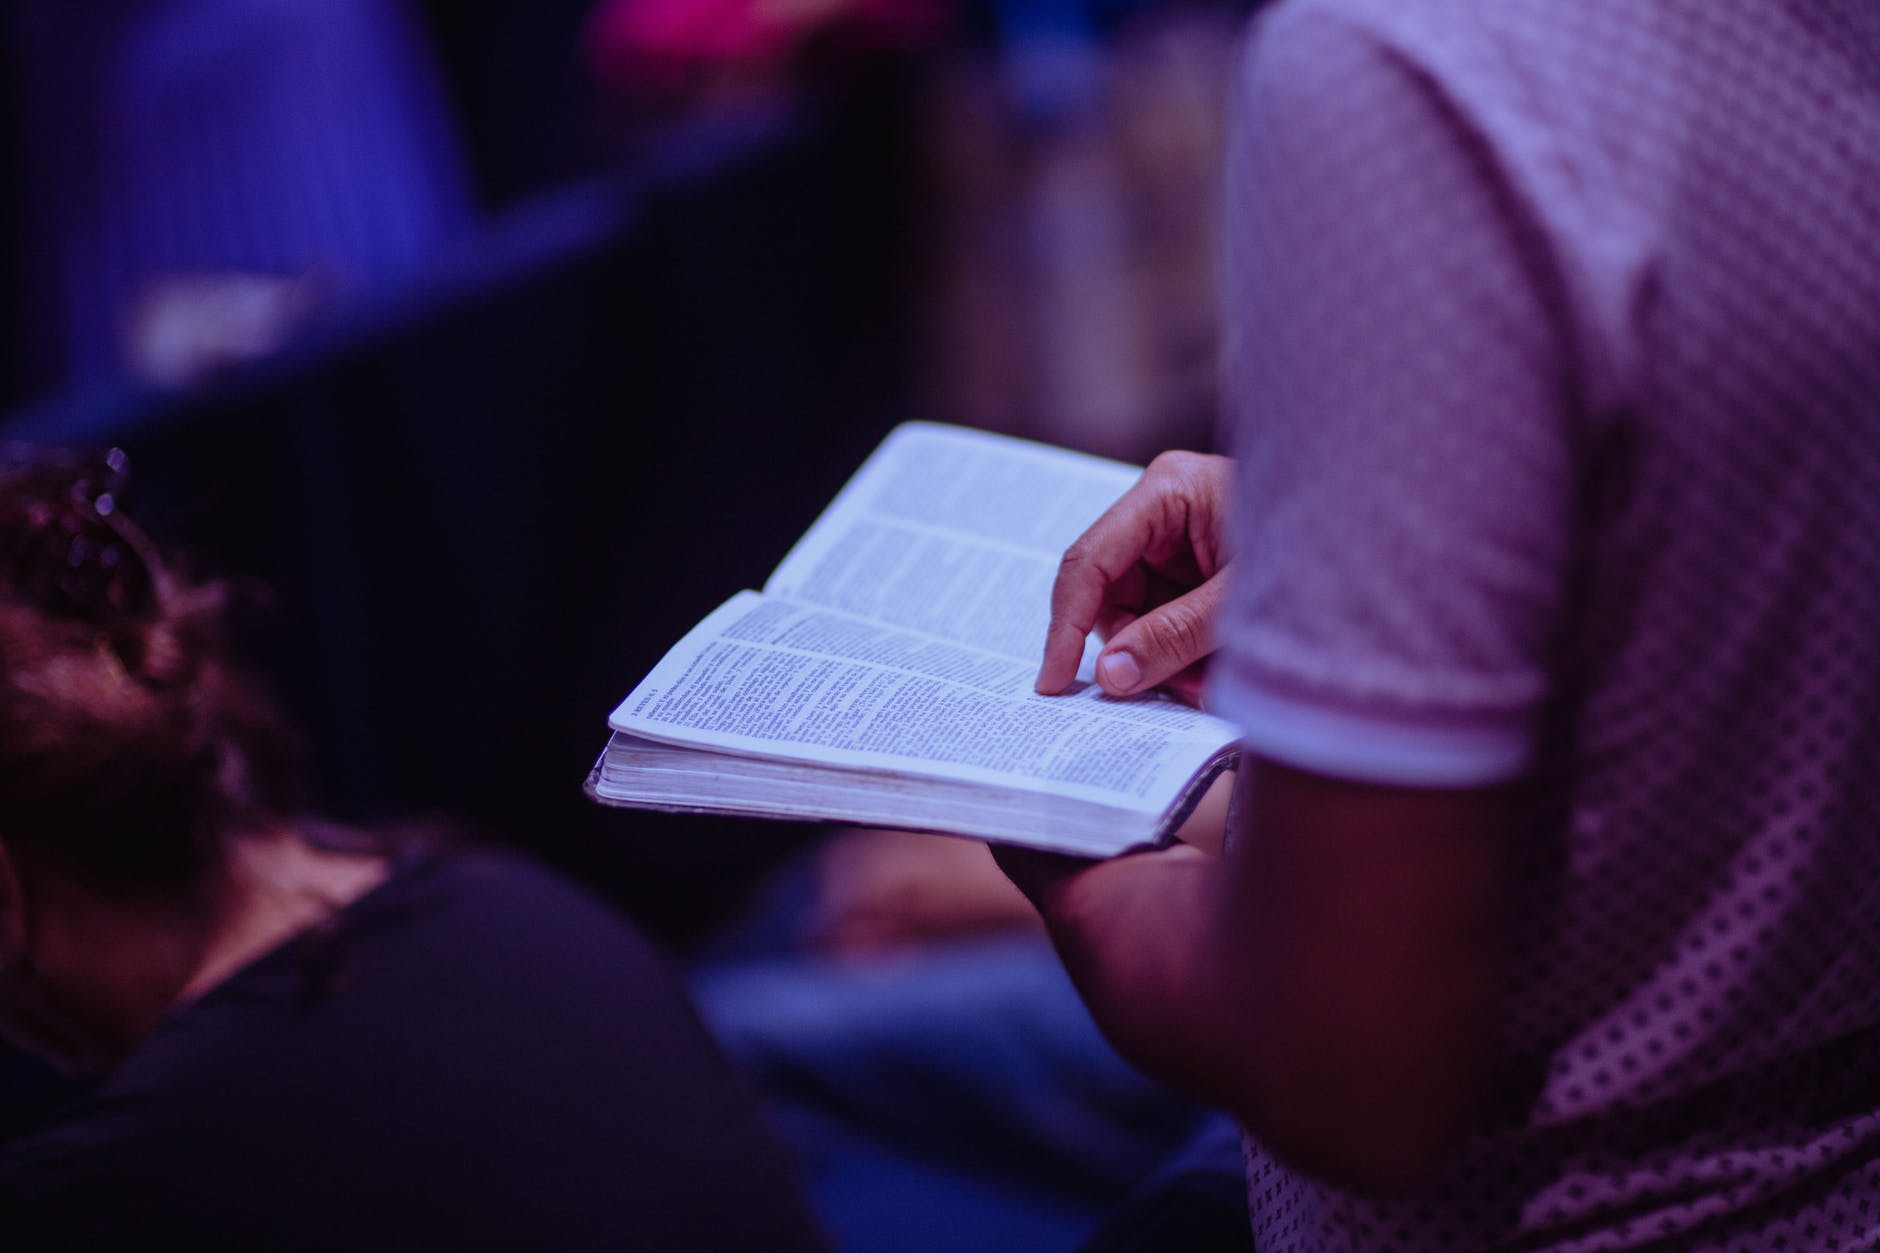
Does this always work? I am thinking of T. M. Luhrmann’s book on religious kindling which involves a lot of discussion of rituals. Replace a religious ritual with an action that tries to invoke something similar – say mindfulness – and does it replace the previous ritual or is it deficient or even better? How much time does it take to adjust from one important rituals or set of rituals to another?
Add technology to this mix – which could help pattern and establish new rituals as well disrupt old patterns such as making work possible at all hours and in all places – and lots of rituals may need reinforcing or replacing.